
Entre em Contato com a BBP


Updated August 2026
Credible vfd pump energy savings roi analysis starts with measured pump duty, not a motor nameplate or a promised percentage. Variable frequency control can cut input energy when demand varies and fixed-speed operation wastes head, but static head, pump efficiency, operating limits, the electricity tariff, and the full installed scope decide whether the project pays.
VFD pump energy savings are defensible only when a measured load profile is combined with the system curve, projected input power, complete installed cost, and a post-commissioning verification plan. The affinity laws can screen the opportunity; they can’t forecast project ROI by themselves.
Decision brief
- Variable demand and throttling are promising signals; constant duty and high static head are warning signs.
- The drive adds electrical losses. Savings come from changing system control, not from making every component more efficient.
- Annual savings must be calculated across operating bins, then priced with the applicable energy and demand tariff.
- Payback must include the entire installed scope, commissioning, downtime, and added annual costs.
- Predicted savings become accepted savings only after the same measurement boundary is used after commissioning.
Quick inputs for a first-pass study
Operating profile
kW and hours by duty bin
kW and hours by duty bin
Hydraulic boundary
flow, total head, static head
flow, total head, static head
Cost boundary
installed cost and annual costs
installed cost and annual costs
Acceptance boundary
same meters and normalization rule
same meters and normalization rule
How VFD Pump Energy Savings Actually Work
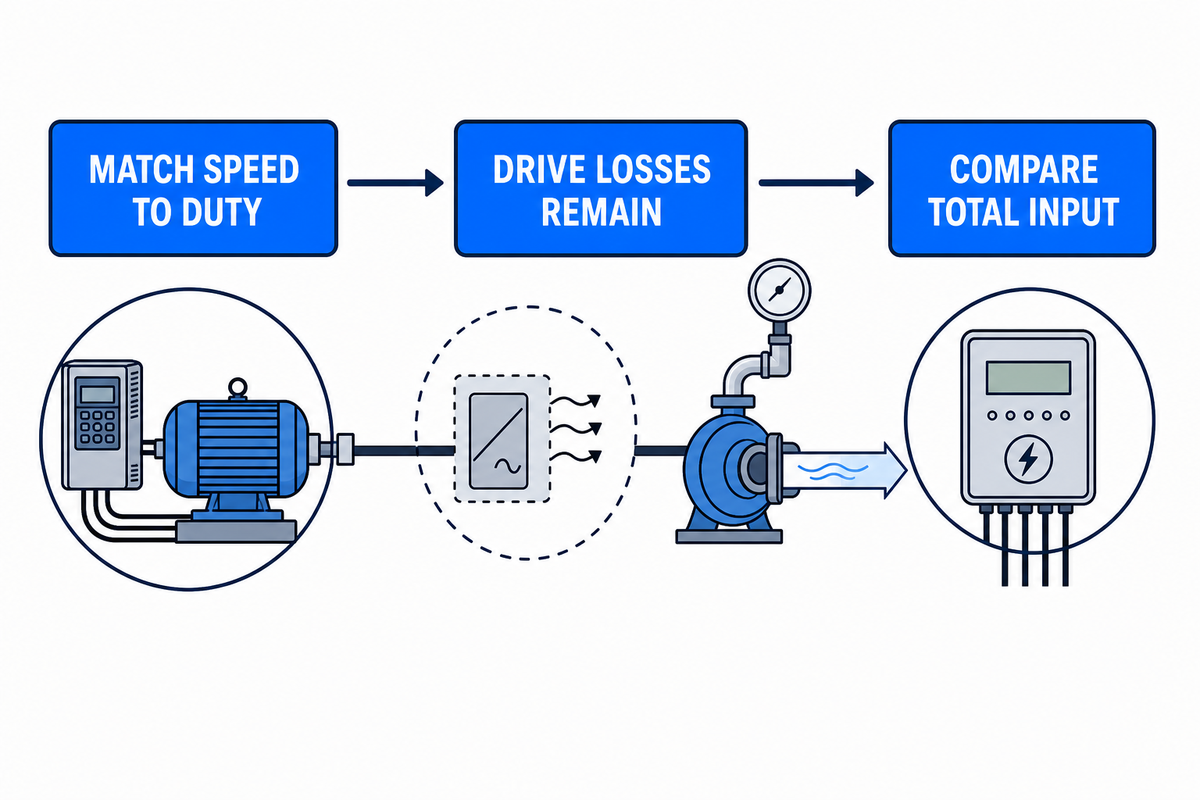
VFD pump energy savings come from matching motor speed to the flow and head the process needs, instead of running at full speed and discarding excess head across a valve or bypass. The drive itself has losses, so the valid comparison is total electrical input for the required hydraulic duty.
Each centrifugal pump operates where its pump curve meets the system curve. Closing a discharge valve changes the system curve while the impeller keeps turning at fixed speed. Changing motor frequency shifts the pump curve. That distinction matters because speed control can remove avoidable hydraulic loss instead of moving it to a control valve.
Hydraulic Institute’s pump FAQ corrects a common misconception: adding a variable-speed drive doesn’t automatically raise wire-to-water efficiency. Pump, motor, and drive losses remain in the chain. System input can still fall when speed control replaces a wasteful control method.
Schneider Electric’s load guidance classifies centrifugal pumps and certain fans as variable-torque loads. This guide stays with liquid pumping: a variable frequency drive changes the supply to electric motors, while the resulting energy consumption depends on the pump curve, system curve, and control target. Good VFD control uses less energy only when lower speed still delivers the required duty.
A practical guide to VFD analysis begins with variable torque applications and the relationship between speed and power, but it does not stop there. Estimate potential savings from the amount of energy consumed with and without a VFD at each duty point. Variable frequency drive energy savings become credible only when the proposed pump speed can reduce energy consumption while maintaining required flow and head; motor horsepower alone cannot establish that result.
| Quantity | Relationship | What it tells you | Limitação |
|---|---|---|---|
| Fluxo | Q₂/Q₁ = N₂/N₁ | Flow follows speed in a similarity case. | The real operating point must still intersect the system curve. |
| Cabeça | H₂/H₁ = (N₂/N₁)² | Available pump head falls quickly with speed. | Static head does not fall with speed. |
| Poder | P₂/P₁ ≈ (N₂/N₁)³ | Part-speed operation can create a large theoretical opportunity. | Pump, motor, and drive efficiencies and operating limits change actual input kW. |
Plant Services’ pump energy explanation presents the same affinity relationships and then requires the reduced-speed pump curve to be intersected with the system curve. That second step is the boundary between a physics screen and an operating forecast.
How much energy does a VFD save?
Savings may be small in a constant-duty, static-head-dominated system or much larger in a friction-dominated system that spends long hours throttled. Demand variation, existing control method, static head, pump efficiency, minimum speed, and tariff all change the answer. Flat 20-50% or 30-70% claims are screening assumptions, not project forecasts.
Treat the drive as a control change at the pump-system boundary. If the proposal cannot show where the new pump curve meets the real system curve, its savings number is not yet an engineering result.
Which Sistemas de bombas Are Strong VFD Candidates?
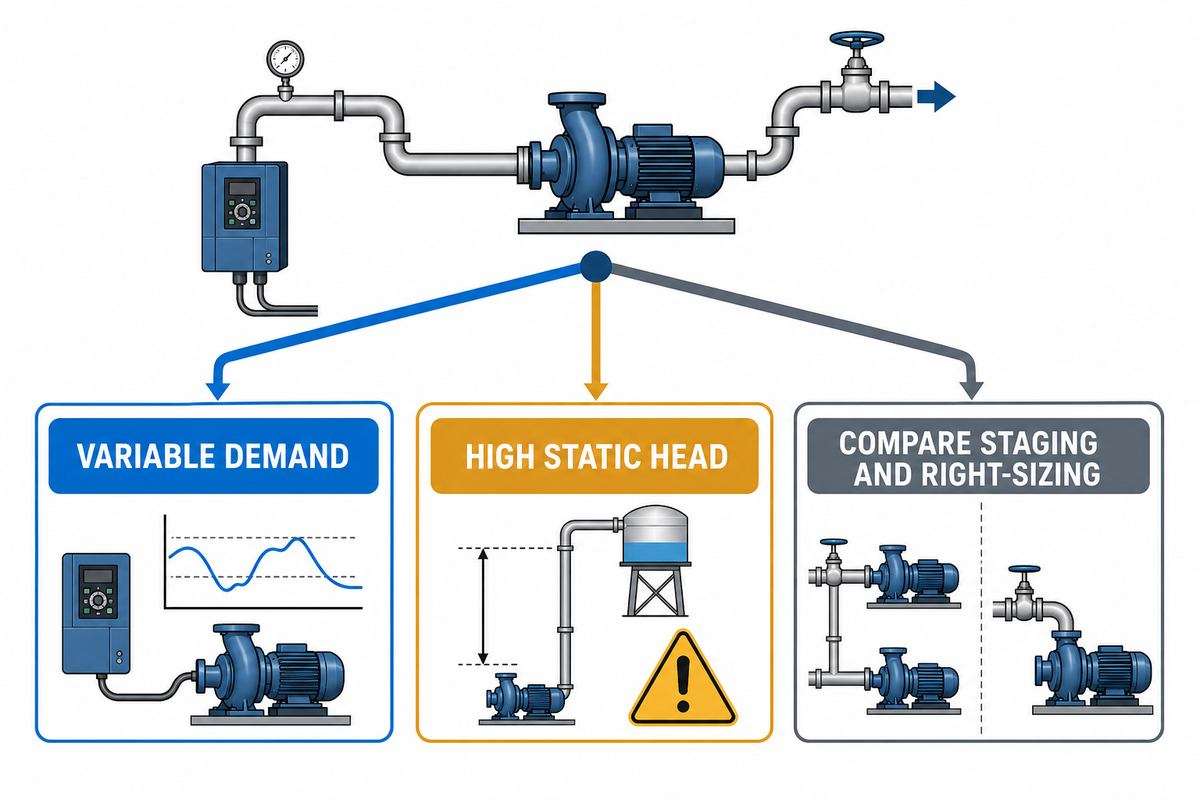
Strong VFD candidates have a real variable-flow or variable-pressure requirement, significant time below peak duty, and an existing control method that wastes head. Weak candidates run near one duty point, must overcome high static pressure, or already use efficient staged control. Screening decides whether to meter, compare alternatives, or stop.
O Hydraulic Institute suitability guide makes the system curve the basis of the decision. For a booster and pipeline pump system, that means separating elevation and required pressure from flow-dependent pipe loss before treating lower speed as lower energy.
For VFD systems, a VFD installation is more than the drive purchase. VFD implementation includes the motor, enclosure, sensors, controls, electrical protection, commissioning, and operating limits. The decision to install a VFD should compare VFD technology and other variable speed technology with staging, trimming, right-sizing, and system changes. A measured reduction in energy may cut energy use, but an industrial energy project still has to satisfy the process.
| Observed condition | Decision signal | Next evidence | Limitations / Not suitable for |
|---|---|---|---|
| Discharge valve frequently throttled | Meter | Valve position, kW, flow, head by hour | Valve may protect a required downstream pressure boundary. |
| Bypass or recirculation carries routine flow | Meter | Main and bypass flow, minimum-flow requirement | A minimum-flow recycle may still be mandatory. |
| Long hours below design flow | Meter | Representative load duration profile | Short or seasonal data can misstate annual hours. |
| Long transfer line with flow-dependent loss | Modelo | System curve and reduced-speed pump curves | Elevation and terminal pressure may still dominate. |
| Variable tank level or pressure setpoint | Modelo | Operating envelope, sensor history, control narrative | Verify control stability across the proposed operating range before including the expected benefit. |
| Nearly constant flow and head | Compare alternatives | Right-sizing and impeller-trim study | Speed variation may have little energy value. |
| High static lift or injection pressure | Model before pricing | Static-head share and minimum speed | Reduced speed may not clear the pressure floor. |
| Parallel pumps already stage efficiently | Compare controls | Staging log and per-pump efficiency | One VFD may not beat well-matched staging. |
| Pump operates near minimum flow | Stop pending review | Vendor operating envelope | Lower speed can move duty outside a reliable region. |
| Solids transport depends on minimum velocity | Stop pending process review | Settling/transport-velocity criterion | Energy reduction cannot come at the cost of deposition. |
What applications offer the energy savings opportunity when using a VFD?
Variable-demand water transfer, booster service, process circulation, cooling-water loops, and pressure-controlled distribution can be good candidates when they spend meaningful time below peak flow. Reduced speed offers the greatest opportunity when it eliminates throttling or bypass loss. Constant-flow service and static-pressure-dominated injection need an alternative comparison before approval.
The Static-Head Savings Reality Check
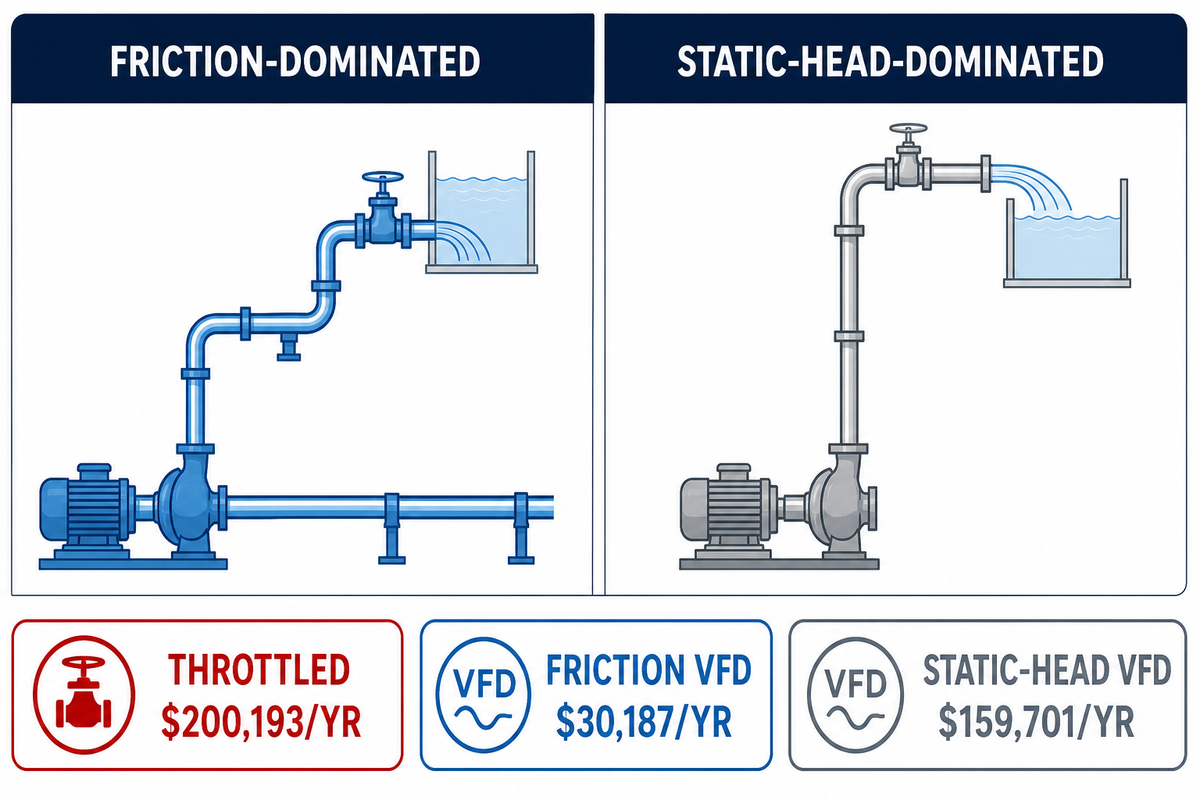
The Static-Head Savings Reality Check asks whether elevation or terminal pressure remains high as flow falls. In a friction-dominated system, lower flow removes much of the required head. In a static-head-dominated system, the pump must still clear a pressure floor, which limits speed reduction and annual energy savings.
One published Pumps & Systems hydraulic example holds target flow at 2,000 gpm and compares throttling with two different system curves. At an assumed $0.10/kWh, its annual energy costs are $200,193 for throttling, $30,187 for the friction-dominated VFD case, and $159,701 for the static-head VFD case. Those figures describe one modeled pump and system, not a savings benchmark.
$200,193/yrthrottled case in the published example
$30,187/yrfriction-dominated VFD case
$159,701/yrstatic-head VFD case
This example does not prove that one project will save 85% and another 20%. Identical flow targets can produce very different input power when the hydraulic boundary changes. Before procurement uses the cube law, engineering should answer three questions: What share of duty head is static? Where does the reduced-speed pump curve intersect the system curve? Does that point remain inside the allowable operating envelope?
Nota de engenharia: Minimum speed set only from motor capability is incomplete. Required minimum speed is the highest of the hydraulic pressure floor, pump operating limit, motor/drive limit, process transport limit, and control-stability limit.
Build the 7-Day VFD Baseline Sheet
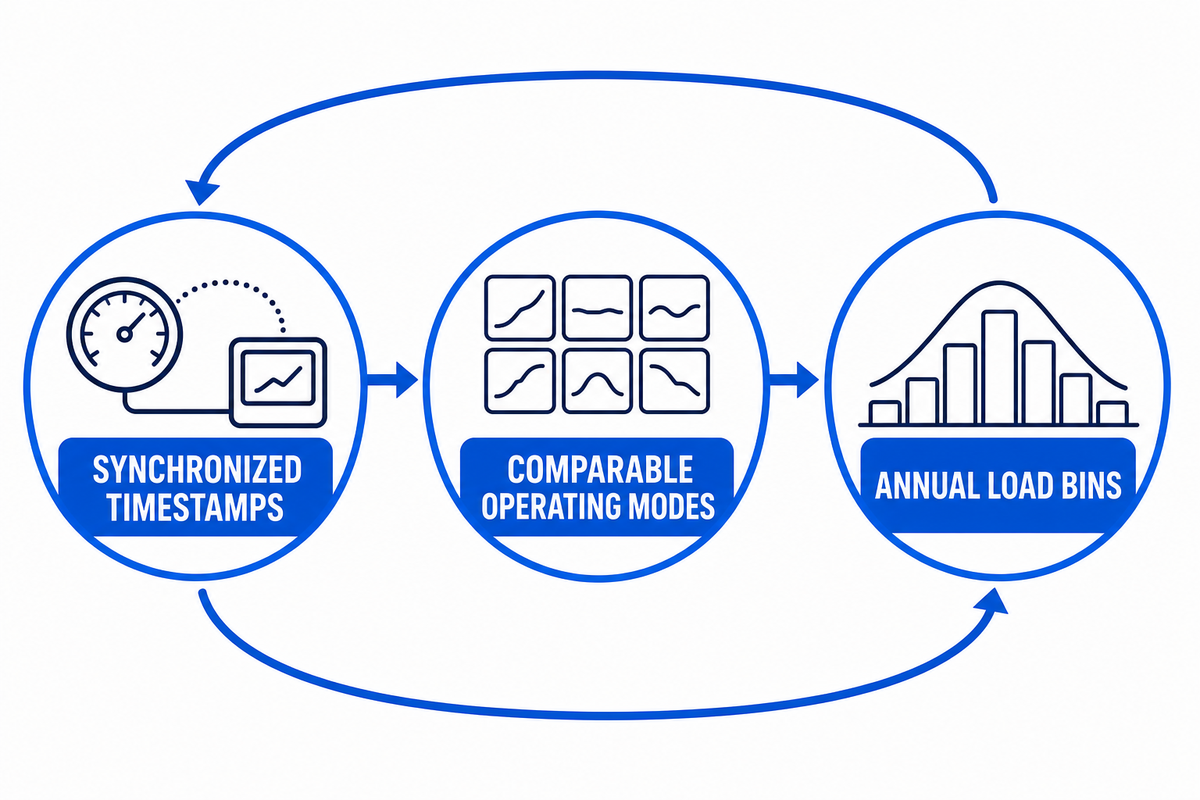
The 7-Day VFD Baseline records input power and hydraulic duty at synchronized timestamps, then groups comparable operating modes into annual load bins. Seven days is a starting window, not proof of representative operation. Seasonal demand, cleaning cycles, and batch changes may require a longer study.
Instituto Hidráulico pump energy calculation guidance relates pump input power to flow, total head, liquid properties, and overall pump-motor-drive efficiency. It also notes that variable flow and pressure require a load profile. In field terms, a kW reading without flow and head can’t show whether the process duty changed.
| Campo | Unit / record | Por que isso importa | Quality flag |
|---|---|---|---|
| Timestamp | Date and time | Aligns electrical and process measurements. | Unsynchronized meters |
| Operating mode | Production / standby / cleaning | Prevents unlike duty from entering one bin. | Temporary or abnormal mode |
| Input power | kW at electrical boundary | Forms the energy baseline. | Nameplate used instead of meter |
| Fluxo | m³/h or gpm | Defines delivered hydraulic duty. | Uncalibrated or missing meter |
| Pressão sucção | kPa, bar, or psi | Supports total-head calculation. | Gauge elevation not recorded |
| Pressão descarga | kPa, bar, or psi | Supports total-head and control-loss review. | Pulsation or unstable reading |
| Speed / frequency | rpm or Hz | Binds duty to the pump curve. | Command value only, no feedback |
| Valve position | % open | Reveals throttling and changing resistance. | Position signal not calibrated |
| Tank level / pressure setpoint | m, %, kPa, bar, or psi | Explains static-head or control changes. | Range not representative |
| Alarm / exception | Text record | Excludes failed sensors and abnormal operation. | Missing operator note |
Group readings only when the operating points represent the same production mode and a comparable total head. Derive annual hours from production schedules, historian records, or other dated evidence. Expand the baseline when the measured week excludes peak season or includes a shutdown.
The baseline also sets the highest defensible savings potential. A smaller motor, a different pump curve, or a lower setpoint may promise more, but the VFD payback analysis must compare as-found and proposed power consumption for the required hydraulic duty.
How to Calculate VFD Pump Energy Savings
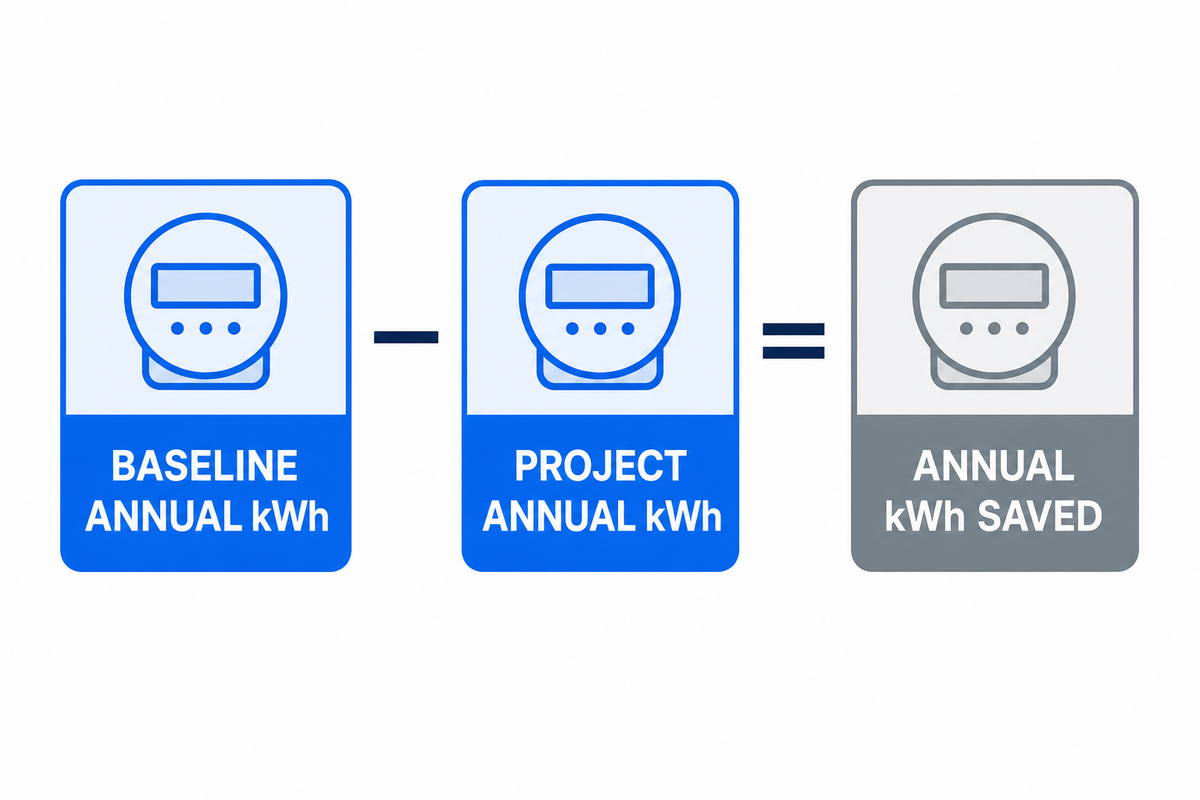
Multiply input power by annual hours for every baseline operating bin, then repeat the calculation with projected input power. Subtract project kWh from baseline kWh to find annual savings. Price each saved kilowatt-hour with the applicable tariff period instead of using one unsupported average.
- Measure the baseline — pair input kW with flow, head, control position, and annual hours for each representative duty bin.
- Model project input power — use a controlled test, validated hydraulic model, or reduced-speed pump curves with stated pump, motor, and drive efficiencies.
- Annualize energy — calculate kWh in every bin and sum the baseline and project columns.
- Price the difference — apply the energy tariff and add demand savings only through a separately documented method.
- Test uncertainty — keep the measured baseline fixed and vary only the inputs that are genuinely uncertain.
Equations: Baseline annual kWh = Σ(kWbaseline,bin × hoursbin). Project annual kWh = Σ(kWproject,bin × hoursbin). Annual kWh saved = baseline annual kWh − project annual kWh.
Um energy savings calculator should expose its bin inputs instead of hiding them behind one percentage. Transparent inputs connect annual energy use to measured operating states and make unsupported hydraulic assumptions visible during review.
| Operating bin | Annual hours | Baseline kW | Project kW | Saved kWh/yr |
|---|---|---|---|---|
| Peak duty | 1,500 h | 100 kW | 90 kW | 15,000 |
| Dever normal | 4,000 h | 75kW | 48 kW | 108,000 |
| Low duty | 2,500 h | 55kW | 28 kW | 67,500 |
| Total | 8,000 h | 587,500 kWh/yr | 397,000 kWh/yr | 190,500 |
At an illustrative $0.10/kWh, the table yields $19,050 per year in energy-cost savings. That result is useful only if the annual hours are representative and the project kW values came from a defensible model or test. Replacing those inputs with a flat percentage would turn a traceable calculation back into a sales estimate.
How to calculate VFD energy savings?
Measure baseline input kW and hydraulic duty across representative load bins. Model or test VFD input kW for the same duty bins. Multiply each kW value by annual hours, sum both columns, and subtract project kWh from baseline kWh. Apply the site tariff to the saved energy, then keep demand and maintenance benefits as separate, documented lines.
BBP boiler-feed-pump TCO calculator may assist with screening, but its methodology considers the output indicative and does not account for capital-cost differences; a finance-ready case must fill that gap.
Use the Meter-to-Money ROI Bridge
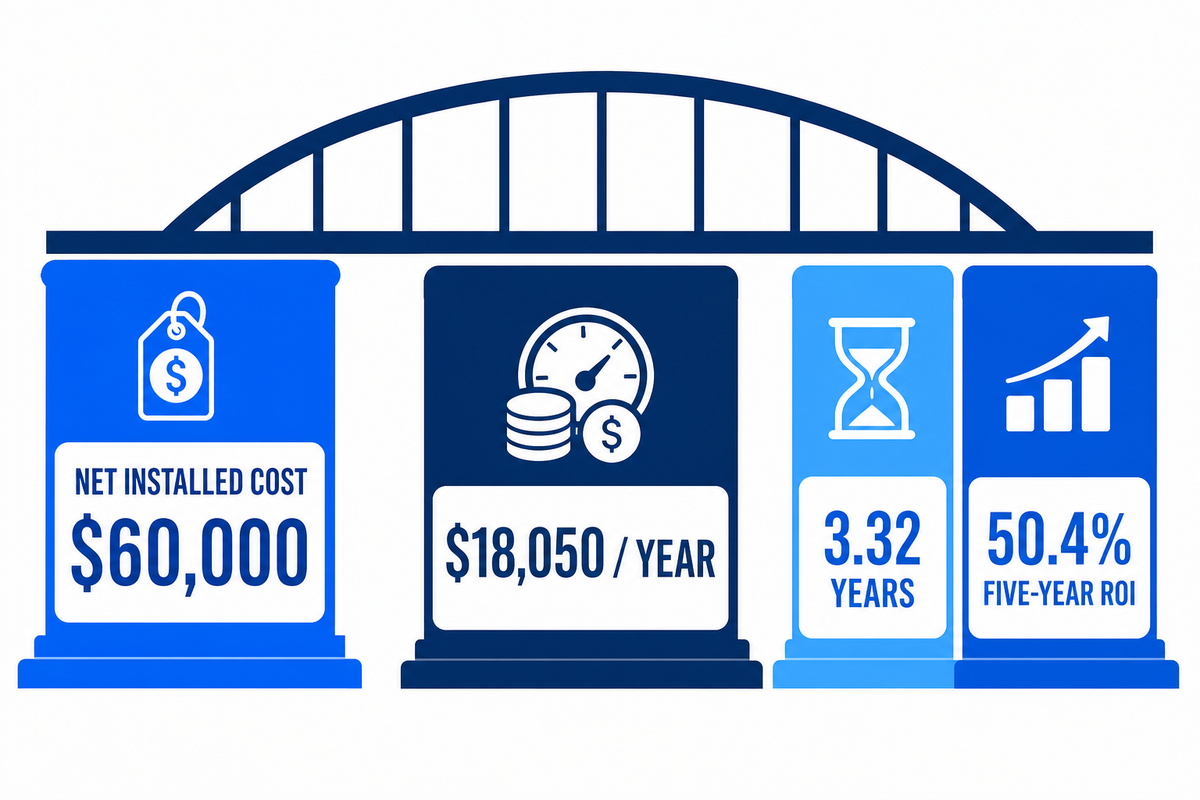
The Meter-to-Money ROI Bridge connects verified annual energy savings to a financial decision by showing every cost and benefit line. Net installed cost reflects the complete project scope. Annual net benefit includes verified energy savings and only those demand or maintenance effects supported by a baseline and attribution method.
Simple payback = net installed cost ÷ annual net benefit. For a five-year view, use ROI = (five-year cumulative net benefit − net installed cost) ÷ net installed cost. Ask finance whether the project review must also account for cash-flow timing, taxes, financing, asset-life effects, discounted cash flow, or net present value.
Keep the return on investment e payback period on the same cost boundary. Removing filters, sensors, commissioning, or downtime makes the proposal look faster to repay even though the physical project has not changed.
A VFD energy savings calculator can organize savings calculations, energy savings estimation, and the ROI calculation, but it cannot choose the cost boundary. A defensible VFD investment shows both initial cost and total initial cost after installation, engineering, downtime, and verified incentives. Report VFD ROI and ROI and payback together so finance can test whether the same inputs produce an accurate ROI.
Illustrative 5-year VFD project case:
| Cost or benefit item | Baseline / no project | VFD project |
|---|---|---|
| Purchase price: drive and enclosure | $0 | $37,000 |
| Instalação e comissionamento | $0 | $20,000 |
| Engineering, training & downtime | $0 | $9,000 |
| Verified incentive | $0 | −$6,000 |
| Net installed cost | $0 | $60,000 |
| Energy (5 yr at illustrative tariff) | $293,750 | $198,500 |
| Maintenance & spares (5 yr) | Not credited | $5,000 added drive/instrument allowance |
| Downtime risk (5 yr) | Not monetized | Not monetized |
| Annual net benefit | — | $18,050/yr |
Payback example: $60,000 ÷ $18,050/year = 3.32 years. Five-year ROI: (($18,050 × 5) − $60,000) ÷ $60,000 = 50.4%. All figures are illustrative, not a BBP quote or performance forecast.
The example does not credit avoided downtime or reduced mechanical stress. Add those benefits to a base case only when the site has a documented failure history, a causal link to the proposed control change, and a method that prevents double counting. Treat incentives as zero until the utility or program administrator confirms eligibility.
Build the approval case
- Keep measured baseline hours fixed across scenarios.
- Price the complete electrical and controls scope.
- Show energy, demand, and maintenance as separate lines.
- Bind acceptance to a repeatable meter boundary.
Reject the shortcut
- Apply one percentage to motor nameplate power.
- Ignore enclosure, filters, sensors, or downtime.
- Count an unapproved incentive.
- Credit maintenance without failure evidence.
Technical Costs and Reliability Checks Before Approval
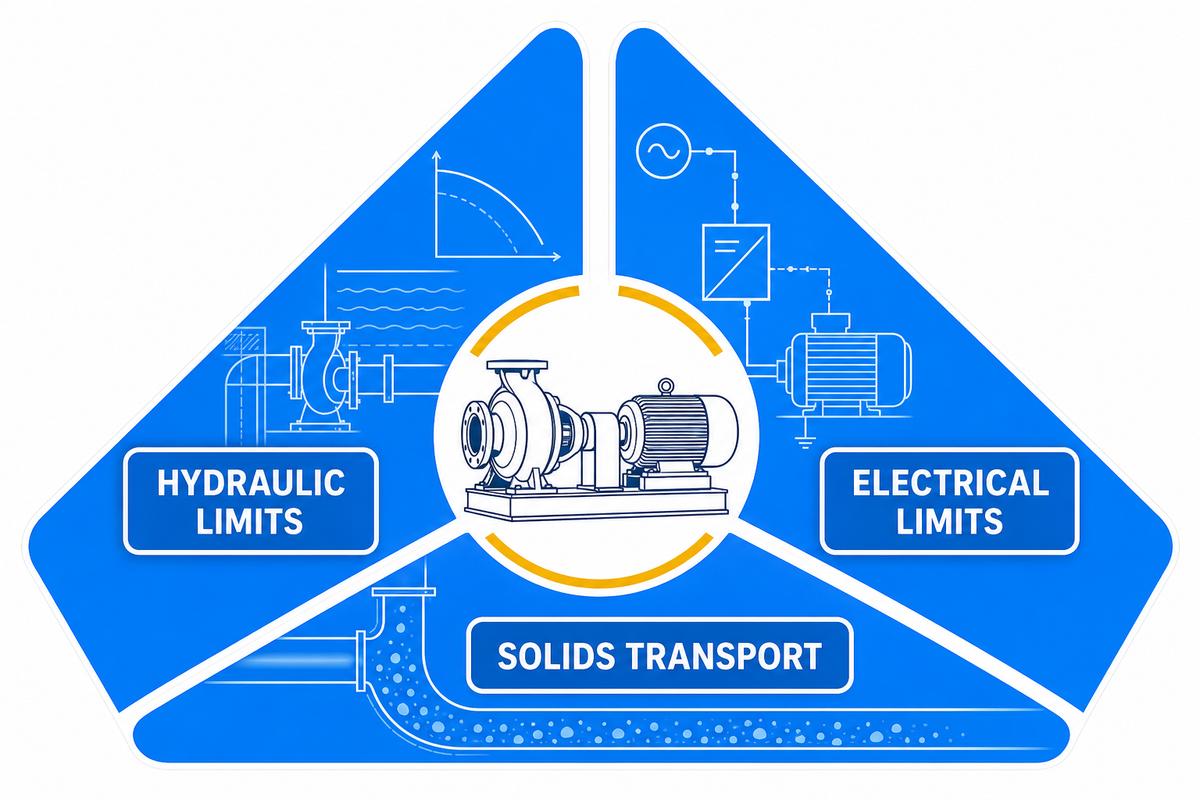
A VFD project is ready for approval only when its speed range works hydraulically, mechanically, electrically, and operationally. Minimum flow, preferred operating region, motor cooling, harmonics, bearing effects, grounding, resonance, and solids transport can add cost or narrow the usable range. Treat sensor-failure behavior and bypass logic as project-specific requirements to be defined before approval.
The Pumps & Systems article “Variable Speed: A Magical Fix for Pumps?” flags drive loss, grounding, bearings, rotor dynamics, critical speeds, and solids service for review after the energy calculation. It is a screening reminder, not a project specification, and lower speed is not automatically safer operation.
| Verificar | Evidence | Owner | Limitation / Not suitable for |
|---|---|---|---|
| Minimum continuous stable flow | Vendor curve/limit | Pump supplier | Do not schedule below the accepted limit. |
| Preferred operating region | Operating points on curves | Pump supplier | Avoid a schedule dominated by off-design duty. |
| Motor low-speed cooling | Motor/drive duty statement | Motor-drive supplier | Require the supplier to confirm the low-speed cooling requirement. |
| Harmonics and filtering | Power-quality study | Electrical engineer | Include any filter or reactor specified by the study in the installed scope. |
| Cable length and insulation | Supplier limits and cable design | Electrical engineer | Confirm protection requirements for the proposed cable length and insulation system. |
| Shaft voltage, bearings, grounding | Grounding/bearing plan | Motor-drive supplier | Do not assume existing grounding is sufficient. |
| Resonance and critical speeds | Restricted-speed bands | Pump supplier | Program skip bands where required. |
| Control stability and sensor failure | Control narrative/FMEA | Controls engineer | Require the project failure review to define fallback values and alarms. |
| Bypass philosophy | Reliability requirement | Site reliability owner | Document whether a bypass is required, its installed cost, and the control modes it must preserve. |
| Solids settling or transport velocity | Process criterion | Process engineer | Reduced speed must not cause deposition. |
In abrasive service, energy is only one part of the decision. The slurry pump total cost of ownership framework shows why wear parts, downtime, and replacement labor need separate evidence instead of being folded into one energy-savings percentage.
Verify Savings After Commissioning
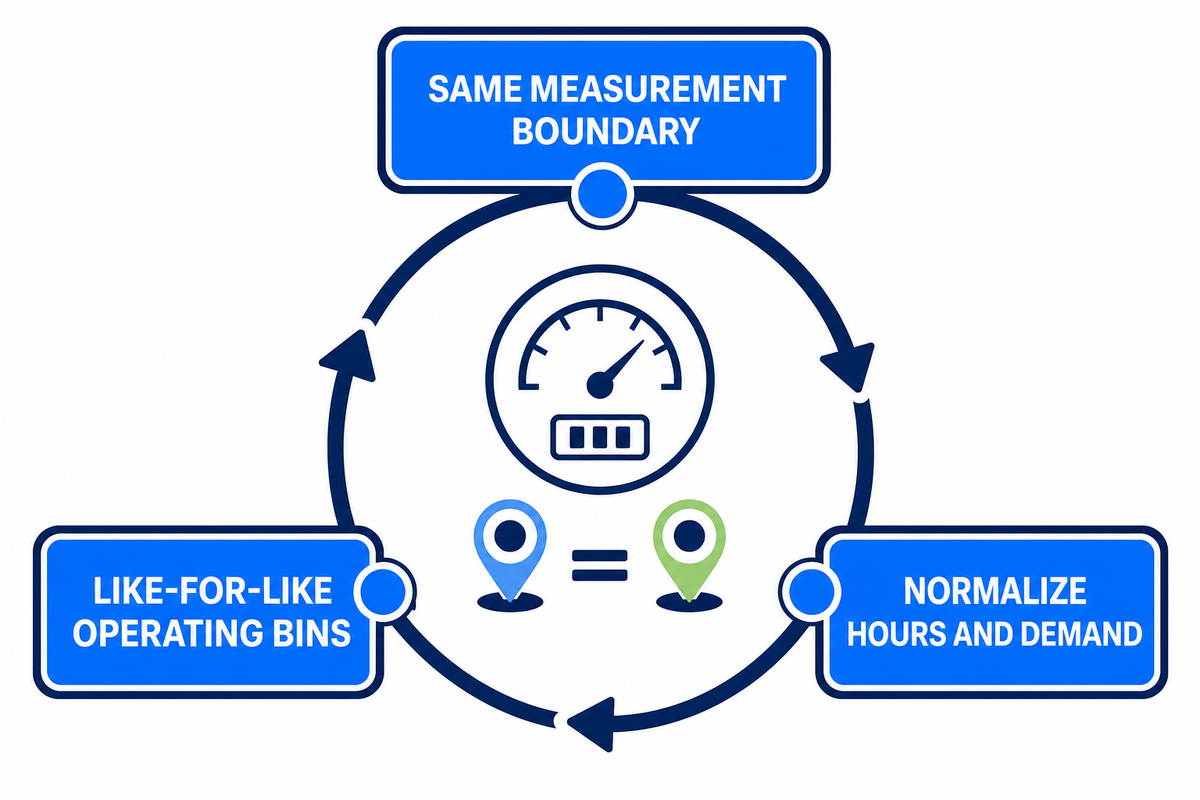
Post-commissioning verification repeats the same measurement boundary used for the baseline. Compare like-for-like operating bins, then normalize them to common operating hours and production demand. Keep projected, commissioning-test, and routine operating savings separate. Put the acceptance method in the request for quotation or purchase order before installation.
The U.S. Department of Energy Pump Systems resources frame savings as a system-level assessment task. Use the same electrical boundary, define the fluid and process conditions, and state the normalization method. If the process mix differs from the proposal, disclose the difference instead of forcing measured data to match the forecast.
Treat savings projections as hypotheses until the meter shows actual energy at comparable duty. Separate potential energy reductions from realistic savings, then translate verified yearly savings into lower energy bills and a clear energy and money bridge. Energy savings alone do not prove the project case, and rebates for VFD installations belong in the model only after eligibility is documented.
| Acceptance item | Linha de base | Post period | Rule |
|---|---|---|---|
| Input power | Metered kW | Same boundary | Calibrated meter and synchronized timestamp |
| Hydraulic duty | Flow and total head | Matched bins | No credit for delivering less required duty |
| Operating hours | Annual profile | Observed hours | Normalize with documented production data |
| Exceptions | Recorded abnormal events | Overrides and alarms | Disclose exclusions rather than silently deleting them |
When a VFD Is Not the Best First Investment
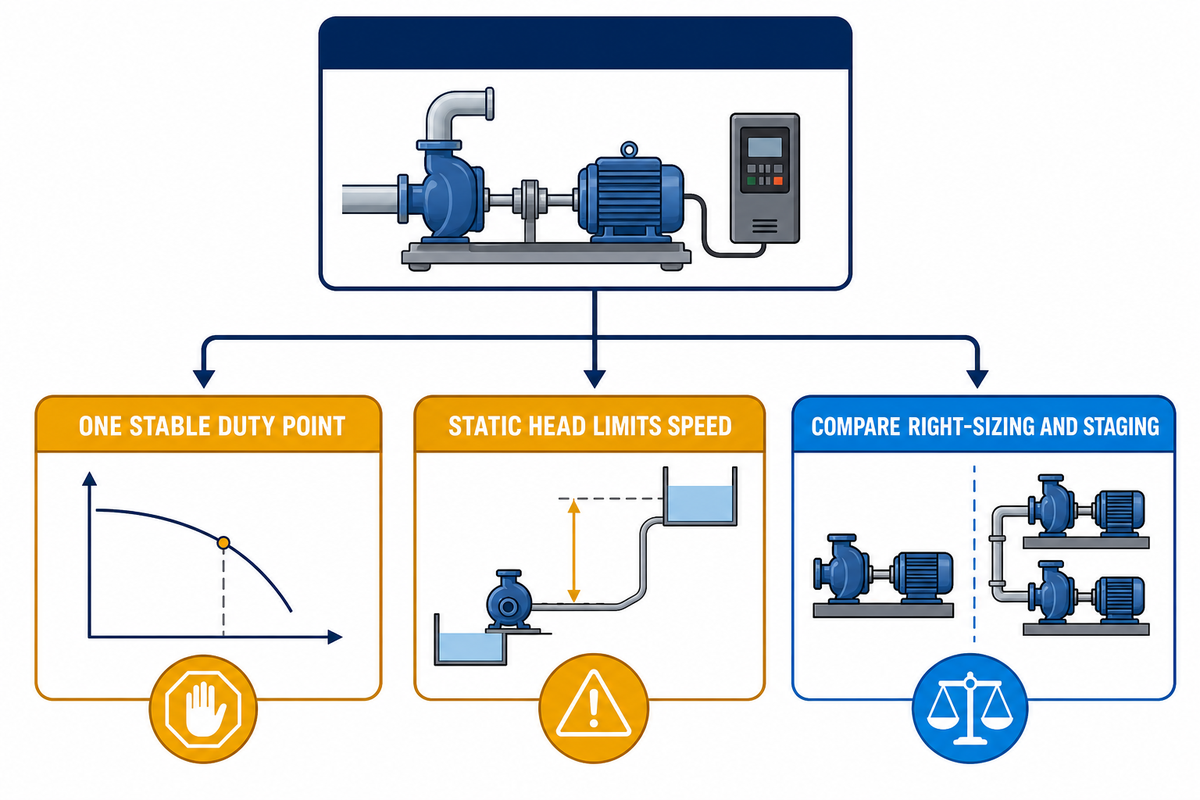
A VFD is not the best first investment when the pump serves one stable duty point, static head prevents useful speed reduction, or the pump is badly oversized. In those cases, impeller trimming, right-sizing, system-resistance reduction, leak repair, parallel staging, or setpoint correction may produce a simpler business case.
Compare alternatives with the same required flow, differential head, operating hours, and control boundary. A smaller pump operating near its efficient region can outperform a larger unit throttled by either a valve or a drive. Well-designed parallel pumps can also cover a wide flow range efficiently, while piping or valve changes may remove permanent system resistance.
If soft starting, process control, or pressure stability is part of the justification, verify and value it separately from energy savings. Labeling every control benefit as “energy efficiency” makes later verification less credible.
From Screening to a Project-Specific Pump Selection
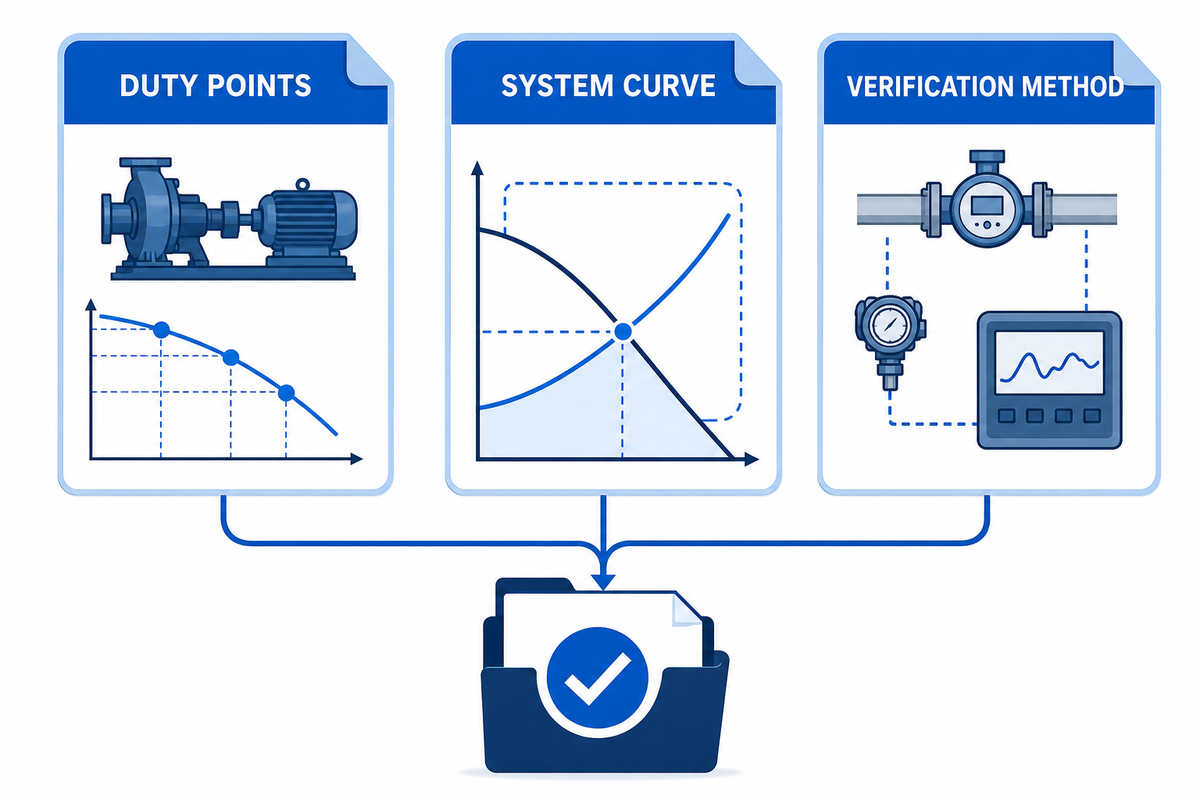
The request for quotation should include motor and drive efficiency data, pump curves, process flow and head, liquid properties, the system curve, operating limits, the normalization method, a system diagram, the control narrative, the complete installed scope, a commissioning plan, and the measurement-and-verification method. One shared package lets procurement, finance, operations, and engineering approve the same assumptions.
Approval owners
- Plant manager: production boundary, allowable downtime, and operating schedule.
- Energy manager: meter boundary, tariff, baseline, and verification rule.
- Maintenance: pump limits, failure history, bypass need, and spares.
- Procurement: complete scope, warranty, documents, training, and acceptance terms.
- Finance: scenario policy, incentive evidence, payback, and cash-flow method.
Check the application against the gama de bombas centrífugas and BBP’s booster and pipeline pump guide. Send specified duty points and limiting system constraints with the request for quotation; a percentage-only request cannot justify equipment selection.
Takeaway chave
A VFD payback becomes decision-ready only when engineering can trace measured kW and hydraulic duty through the system model, installed scope, annual benefit, and post-commissioning acceptance test.
Have a pump load profile ready?
Send BBP your low, normal, and peak duty points, annual hours, system-curve information, power supply, liquid properties, and control objective. Include these inputs so the request is based on the pump and VFD boundary rather than a percentage-only savings estimate.
Perguntas frequentes
Quanta energia um VFD economiza em uma bomba?
Savings depend on the measured system.
Um VFD pode economizar pouco ou muito dependendo da variação da demanda, perda de controle existente, cabeçote estático, eficiência da bomba, velocidade mínima e horas anuais. Use a relação do cubo apenas como uma tela inicial. Uma previsão do projeto precisa de um perfil de carga medido, compartimentos operacionais anuais e pontos operacionais da bomba/sistema de velocidade reduzida.
Como você calcula o retorno da bomba VFD?
Divide net installed cost by annual net benefit.
O custo líquido instalado inclui equipamentos, trabalhos elétricos, instrumentos, controles, engenharia, comissionamento, treinamento, tempo de inatividade e qualquer incentivo verificado O benefício líquido anual inclui economia de energia medida mais demanda suportada separadamente ou economia de manutenção, menos custos anuais adicionados Declarar cada entrada e manter as unidades de moeda e tempo consistentes Se o benefício líquido anual for zero ou negativo, o retorno simples não é significativo e a proposta precisa de uma justificativa diferente.
Os VFDs são sempre mais eficientes?
No; the drive adds losses.
Uma unidade não melhora automaticamente a eficiência fio-água em um determinado fluxo Pode reduzir a energia total quando o controle de velocidade substitui estrangulamento, desvio ou outro método de desperdício O teste correto compara a entrada elétrica enquanto fornece o mesmo fluxo e cabeçote necessários, com perdas de bomba, motor, acionamento e controle incluídas em cada ponto de operação.
Uma calculadora de poupança VFD online pode prever meu projeto?
A calculator is a screen, not a guarantee.
As calculadoras organizam suposições, mas não podem substituir uma curva do sistema, um dever medido, um custo instalado ou um teste de aceitação.
Os VFDs reduzem os custos de manutenção da bomba?
They may, but the benefit needs attribution.
Treat maintenance effects as project hypotheses. Verify them from the site’s failure history, the proposed duty, and the supplier’s maintenance requirements before assigning savings or avoided downtime.
How long do pump VFDs last?
Use supplier conditions, not a universal lifespan.
Ask the supplier for rated environmental and duty conditions, maintenance intervals, warranty, expected replacement components, lifecycle support, and a spare-parts policy. Use that project-specific evidence in the lifecycle model instead of assuming one service life for every pump VFD.
Do soft starters save the same energy as VFDs?
No; they serve different control purposes.
Schneider Electric’s comparison explains that a soft starter ramps a motor between stopped and full speed, while a VFD can control running speed. If the energy opportunity depends on reduced operating speed, a soft starter does not perform the same function, although it may still address starting-current or mechanical-shock concerns.
Method and disclosure
This guide separates documented engineering relationships and published examples from hypothetical calculations. Illustrative values aren’t quotations, guarantees, or predictions for a specific installation. Final results require verified site data, supplier curves, an agreed installed scope, and post-commissioning measurement.
Related BBP resources
Referências e fontes
- Pump FAQs: variable-speed-drive efficiency and pump-system assessment Instituto Hidráulico
- Pump Energy Savings with VFDs — Plant Services
- Does a Variable Speed Pump Make Sense for You? Instituto Hidráulico
- Pump Savings Calculator and How to Calculate Energy Instituto Hidráulico
- How to Evaluate VFD Speed Effect on Hydraulics & Sistemas
- Variable Speed: A Magical Fix for Pumps? Part 2 & Sistemas
- VFD and Soft Starter Differences — Schneider Electric
- Sistemas de bombas Ônibus. Departamento de Energia




![Cavitação em Bombas de Polpa NPSH Solids Onset [Guia de Campo]](https://bbpmfg.com/wp-content/uploads/2026/07/cavitation-in-slurry-pumps-featured-1-150x150.png)