Get in Touch with BBP

![Pump Power Formula: Hydraulic, Shaft & Motor Power [Guide]](https://bbpmfg.com/wp-content/uploads/2026/08/pump-power-formula-featured.png)
Updated August 2026
The pump power formula is the equation that converts flow rate and head into hydraulic, shaft, or motor power, depending on which point in the energy chain you’re measuring. Every version you find online reduces to the same three inputs: how much fluid you’re moving, how high you’re lifting it, and how efficiently your pump does the lifting. The confusion isn’t the math, it’s that three different numbers all get called “pump power” depending on where you measure them. This guide give you the metric and imperial formulas with a worked example, then the four calculations that follow logically from the first one: efficiency, head, NPSH, and motor sizing.
Quick Specs, Pump Power Formula Variables
| Symbol | Variable | SI Unit | US Unit |
|---|---|---|---|
| Q | Flow rate | m³/h | GPM |
| H | Total dynamic head | m | ft |
| SG | Specific gravity | 1.0 for water | 1.0 for water |
| η (eta) | Pump efficiency | decimal, e.g. 0.72 | decimal, e.g. 0.72 |
| Ph | Hydraulic power | kW | HP |
| Ps | Shaft (brake) power | kW | HP (BHP) |
| N | Pump speed | rpm | rpm |
| 1 kW | Unit conversion | 1 kW | 1.341 HP |
The Pump Power Formula (Metric and Imperial)
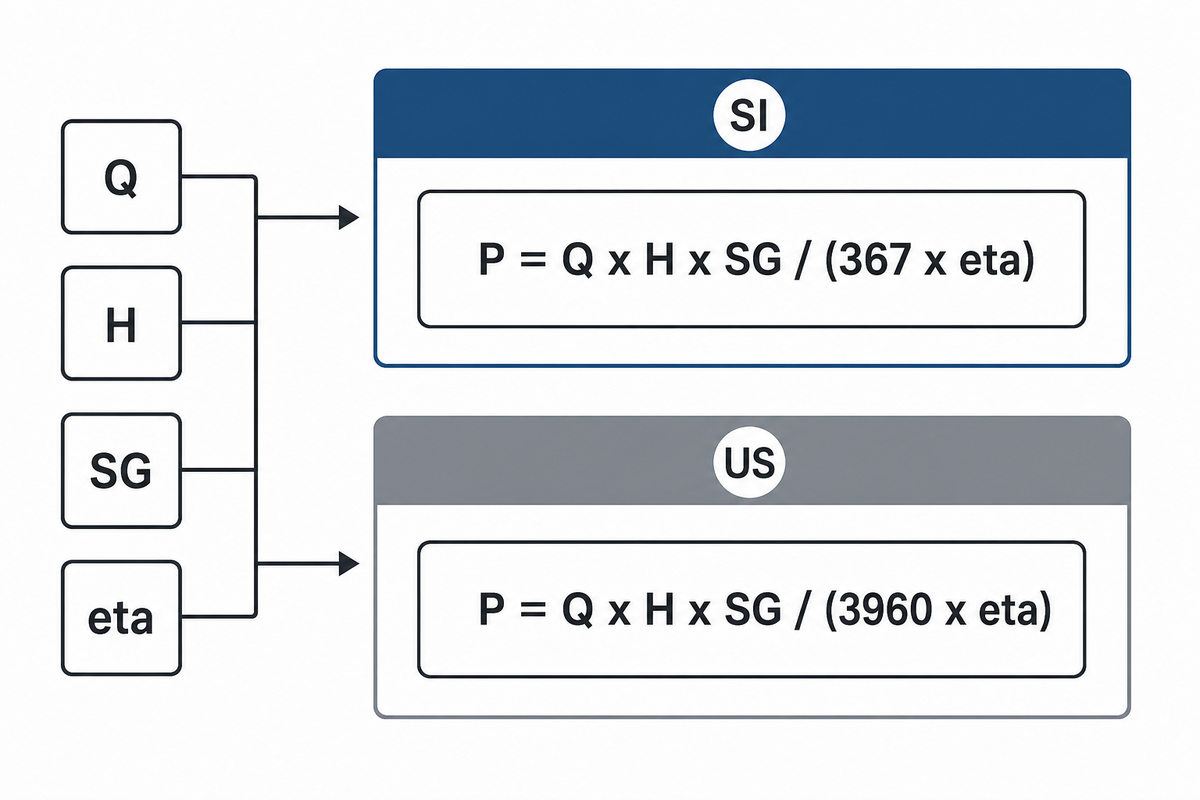
Pump power in kilowatts equals flow rate times head times specific gravity, divided by a unit constant and pump efficiency; the same relationship in horsepower uses gallons per minute, feet of head, and a different constant. Both forms describe hydraulic power, the energy actually transferred to the fluid, and both come from the same physics, just expressed in different unit systems.
In SI units, per the Hydraulic Institute’s pump fundamentals reference:
P (kW) = Q (m³/h) × H (m) × SG ÷ (367 × η)
In US customary units, per the same Hydraulic Institute reference and corroborated by Engineering ToolBox’s pump power calculator:
P (HP) = Q (GPM) × H (ft) × SG ÷ (3960 × η)
📐 Worked Example
A pump moving 250 m³/h (about 1,101 GPM) against 60 m of head (about 197 ft), at 72% efficiency and SG = 1.0 (water):
Metric: P = (250 × 60) ÷ (367 × 0.72) = 15,000 ÷ 264.2 ≈ 56.8 kW
Imperial: P = (1,101 × 197) ÷ (3960 × 0.72) ≈ 76.1 HP
56.8 kW × 1.341 = 76.2 HP, the two unit systems land on the same answer, which is a useful sanity check any time you run this calculation by hand.
Every credible pump power calculation answers the same underlying question: what power requirement does the fluid work translate into, and what amount of energy does that represent in your target unit system. The formula to calculate it doesn’t change between manufacturers, what differs across published pump formulas and pump calculations guides is which of the four downstream numbers this page covers next, and whether the required pump power figure being quoted is hydraulic, shaft, or motor input power.
This is hydraulic power the theoretical minimum energy the fluid actually receives. It isn’t what your motor draws from the wall, and it isn’t what a driver nameplate should read. Those are the next two numbers — together with efficiency, the three variables form what we’ll call The Q-H-η Power Chain running through every section on this page: change any one of the three, and the power figure moves with it.
The Q and H terms swing enormously across pump types even though the formula itself never changes, here’s that range across nine BBP product families, from clean-water booster duty to boiler-feed multistage — call it The 9-Family BBP Flow-Head Envelope:
| Pump Type / Product Family | Max Flow (Q) | Max Head (H) | Typical Duty |
|---|---|---|---|
| Slurry pumps | 12,000 m³/h | 90 m | Mining, mineral processing |
| Sand & dredge pumps | 10,000 m³/h | n/a (open discharge) | Dredging, gravel transfer |
| Sewage pumps | 5,000 m³/h | 80 m | Wastewater, lift stations |
| Centrifugal water pumps | 3,000 m³/h | 150 m | HVAC, building services |
| Split-case pumps | 8,000 m³/h | 220 m | Fire protection (NFPA 20 listing available) |
| Multistage pumps | 1,000 m³/h | 800 m | Boiler feed, high pressure |
| Booster & pipeline pumps | 2,500 m³/h | 200 m | Inline pressure boost |
| Deep well pumps | 500 m³/h | 500 m set depth | Submersible deep well |
| Mixed flow & irrigation pumps | 30,000 m³/h | 3-30 m | Agriculture, drainage |
Note that maximum flow and maximum head aren’t simultaneous operating points on any single pump curve, a pump hit peak head near shutoff (near-zero flow) and peak flow at its lowest head. These are family-level envelopes across each product line’s model range, not one unit’s duty point; use the worked-example method above with your actual duty point’s Q and H, not these ceiling figures.
Hydraulic Power vs. Shaft Power vs. Brake Horsepower
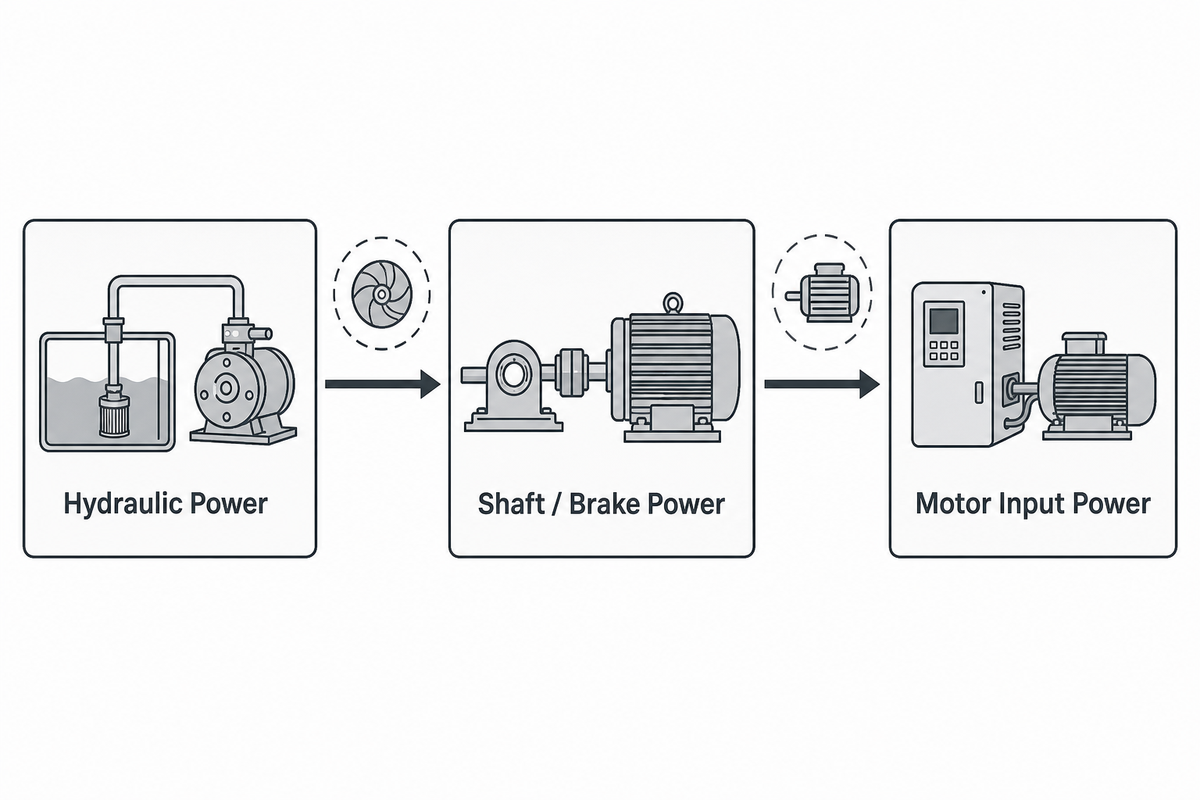
Three different power numbers show up for the same pump because each one measure a different point in the energy chain: hydraulic power is what the fluid receives, shaft power (also called brake horsepower) is what the pump’s shaft absorbs to deliver that hydraulic power, and motor input power is what the electrical system draws to turn the shaft. Each step lose some energy, so the three numbers form a strict order, hydraulic power is always the smallest of the three.
On any centrifugal pump power breakdown, the useful power output is always the smallest number in the chain: mechanical power delivered to the shaft covers pump losses, and the electrical power of a pump’s driveline, what’s actually consumed by the pump motor, covers both pump and motor losses stacked together.
“Note: it is not the average efficiency of the two factors, which is a common mistake.”
— Jim Elsey, mechanical engineer and ASME member, on multiplying (not averaging) pump efficiency and motor efficiency to get true wire-to-water efficiency, Pumps & Systems
| Power Type | What It Measures | Formula Basis | Where Quoted |
|---|---|---|---|
| Hydraulic (water) power | Energy delivered to the fluid, at 100% efficiency | Q × H × SG ÷ constant | Pump curve chart, this page’s formula |
| Shaft / brake power (BHP) | Energy the pump shaft absorbs, includes pump efficiency loss | Hydraulic power ÷ η | Pump datasheet, driver sizing |
| Motor input power | Electrical energy drawn, includes motor efficiency loss | Shaft power ÷ motor η | Utility bill, motor nameplate current |
When a supplier’s quote and a motor nameplate show two different power figures for what looks like the same pump, they’re almost never measuring the same point in this chain, check which of the three the number actually refers to before assuming one of them is wrong.
Where Pump Efficiency (η) Comes From
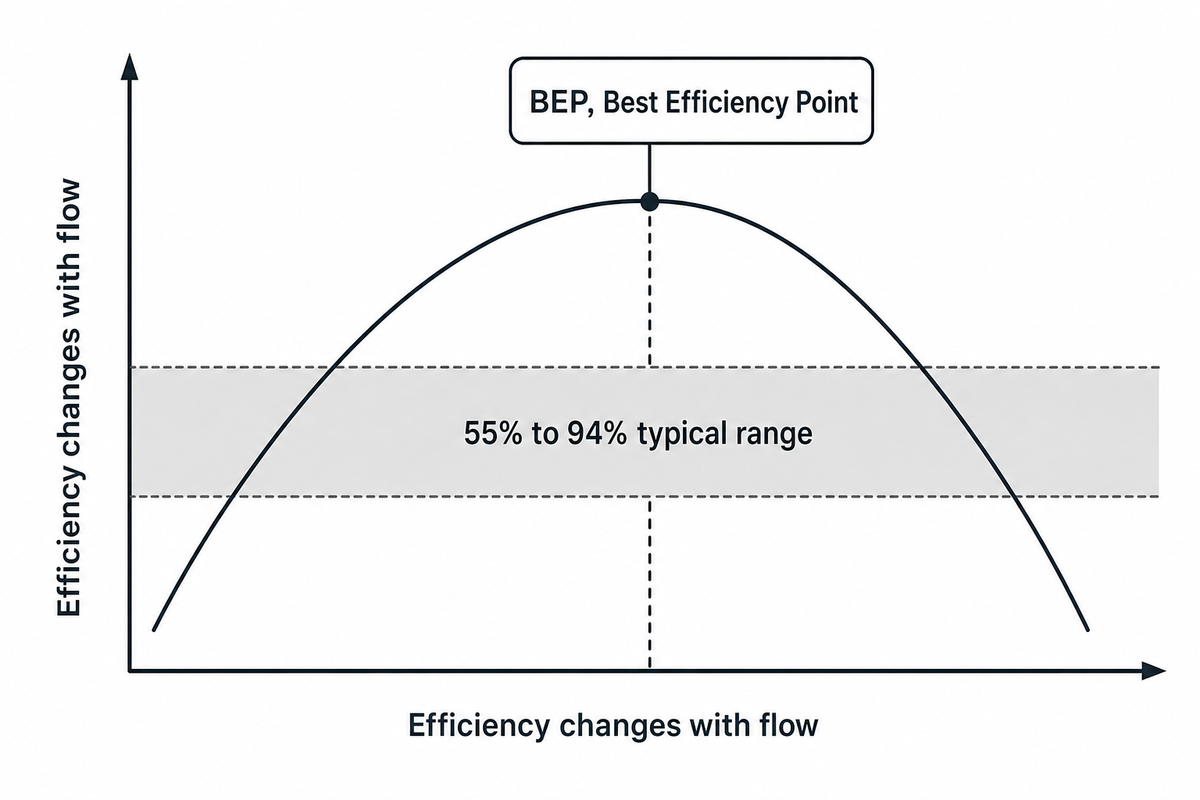
Pump efficiency isn’t a constant you look up once, it’s read from your specific pump’s performance curve at your actual operating point, because efficiency changes with flow rate and peaks at only one point on that curve, the best efficiency point (BEP). Using a generic textbook default instead of your pump’s own curve is the single most common error in this whole calculation.
Every one of the variables involved in pump performance, flow, head, viscosity, wear, funnels into this single number. Power loss due to inefficiencies in the impeller and volute shows up here as reduced efficiency; separate inefficiencies in power transmission between motor and shaft, coupling losses, bearing friction, are a distinct pump performance factor that shows up in the motor-to-shaft power gap discussed above, not in this efficiency figure.
Typical centrifugal pump efficiency, per mechanical engineer Jim Elsey writing in Pumps & Systems, runs about 55% for small pumps, 70% for large pumps, and can approach 94% at the high end. That’s a wide enough spread that guessing costs you real accuracy: a 10-percentage-point error in η, say, assuming 72% when your pump actually runs 62% at that flow, throws the calculated power off by roughly 15-20%. On our 56.8 kW worked example, that’s a 9-11 kW miss, easily the difference between a motor that runs cool and one that trips on overload.
| Pump Class | Typical Efficiency |
|---|---|
| Small centrifugal pumps | ~55% |
| Large centrifugal pumps | ~70% |
| Best-in-class, at BEP | up to ~94% |
Finding Your Head (H) Value, Total Dynamic Head
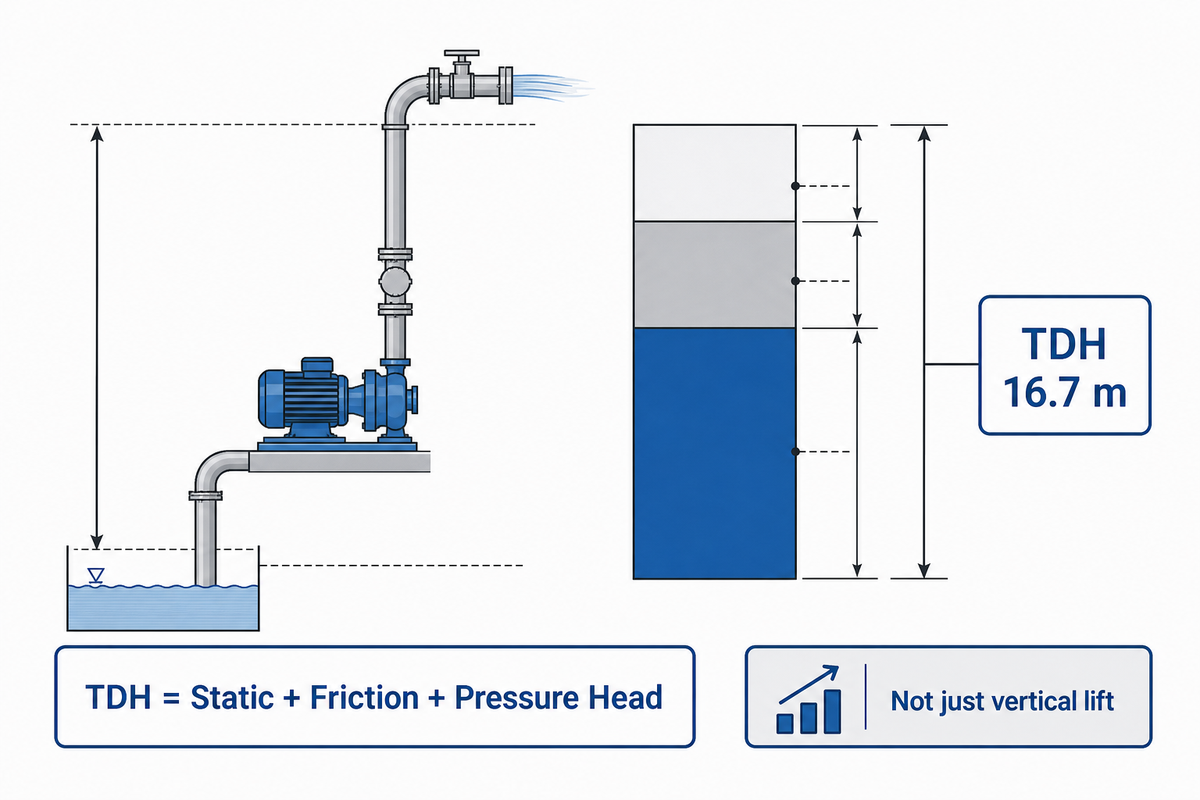
Total dynamic head is the sum of three components, static head, friction head, and pressure head, and you need the sum, not just the vertical lift, before the power formula give you a real answer. Skipping the friction and pressure terms is the second most common source of an undersized pump.
TDH = Static Head + Friction Head + Pressure Head
📐 Worked Example
Static head (elevation change) 12 m + friction head (pipe/fitting losses at design flow) 3.5 m + pressure head (discharge tank pressure converted to head) 1.2 m = TDH 16.7 m. That 16.7 m, not the 12 m of physical lift, is the H value that belongs in the power formula.
Getting this number right matters more than most engineers assume when pumping water long distances or through undersized piping, since friction losses scale with the square of velocity: doubling flow through the same pipe roughly quadruples the friction component of pump head, even though static head hasn’t changed at all.
Static head you can measure with a tape and a level. Friction head depends on pipe diameter, length, material roughness, and every fitting and valve in the run — BBP’s total dynamic head calculator walks through that sum for a given pipe schedule and flow rate rather than requiring a hand calculation.
NPSH, the Companion Number Every Pump Buyer Also Needs
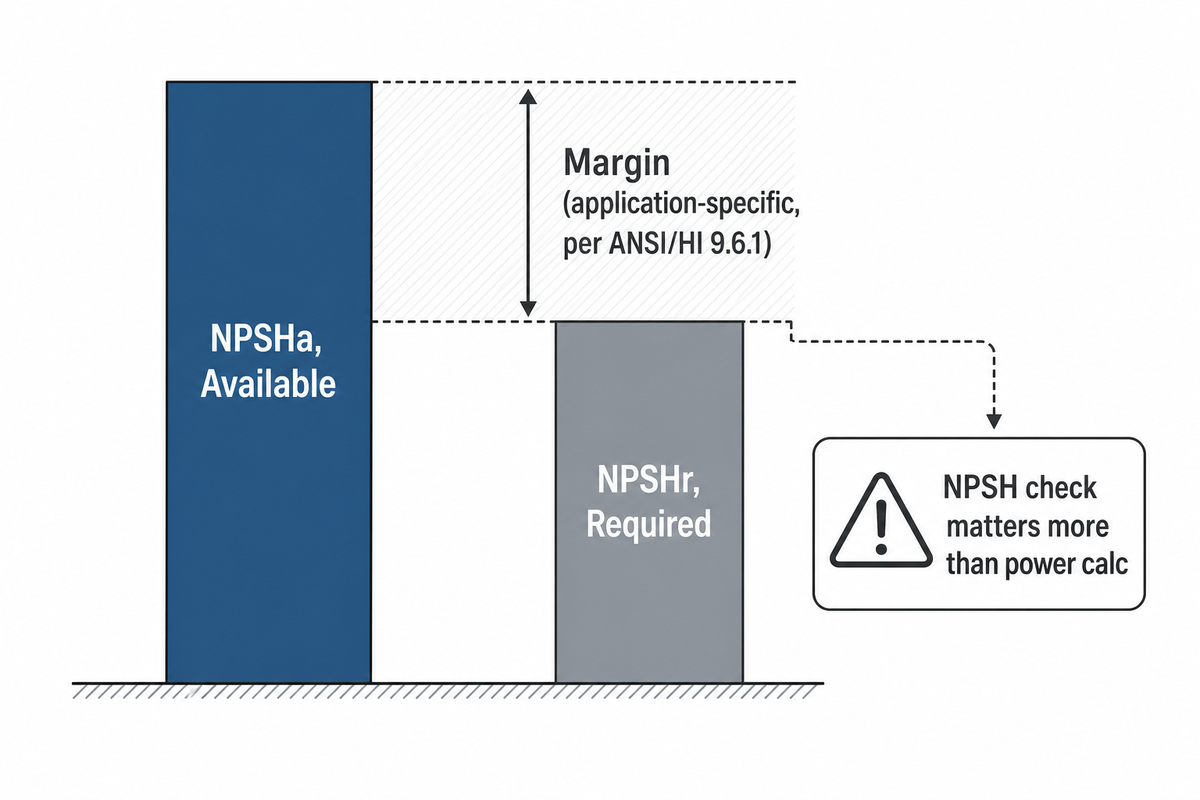
Calculating power tells you how big a driver you need; it says nothing about whether the pump will cavitate, which is a separate check governed by net positive suction head (NPSH). Available NPSH at the suction (NPSHa) must clear the pump’s required NPSH (NPSHr) with margin, run the power formula and the NPSH check as two separate, mandatory steps, not one.
The Hydraulic Institute’s NPSH margin guideline, updated in the 2024 edition of ANSI/HI 9.6.1, moved away from a single flat percentage: it now bases the margin on manufacturer-supplied NPSHR (required NPSH) rather than the older NPSH3 reference point, with recommendations that vary by application rather than one universal number. Absent a specific application recommendation, North Ridge Pumps offers a simplified field rule of at least 10% margin above NPSHR to absorb pump wear and real-world system losses, useful as a first check, not a substitute for the application-specific figure in the current standard.
If your application involves suction lift, hot liquids, or altitude above sea level, the NPSH check matters more than the power calculation, an underpowered motor run hot; a cavitating pump destroys its impeller. See our pump cavitation causes and prevention guide and, for solids-bearing service, cavitation in slurry pumps for the deeper walkthrough; BBP’s NPSH margin calculator runs the numbers for a vertical inline duty point.
Affinity Laws, How Power Changes When You Change Speed
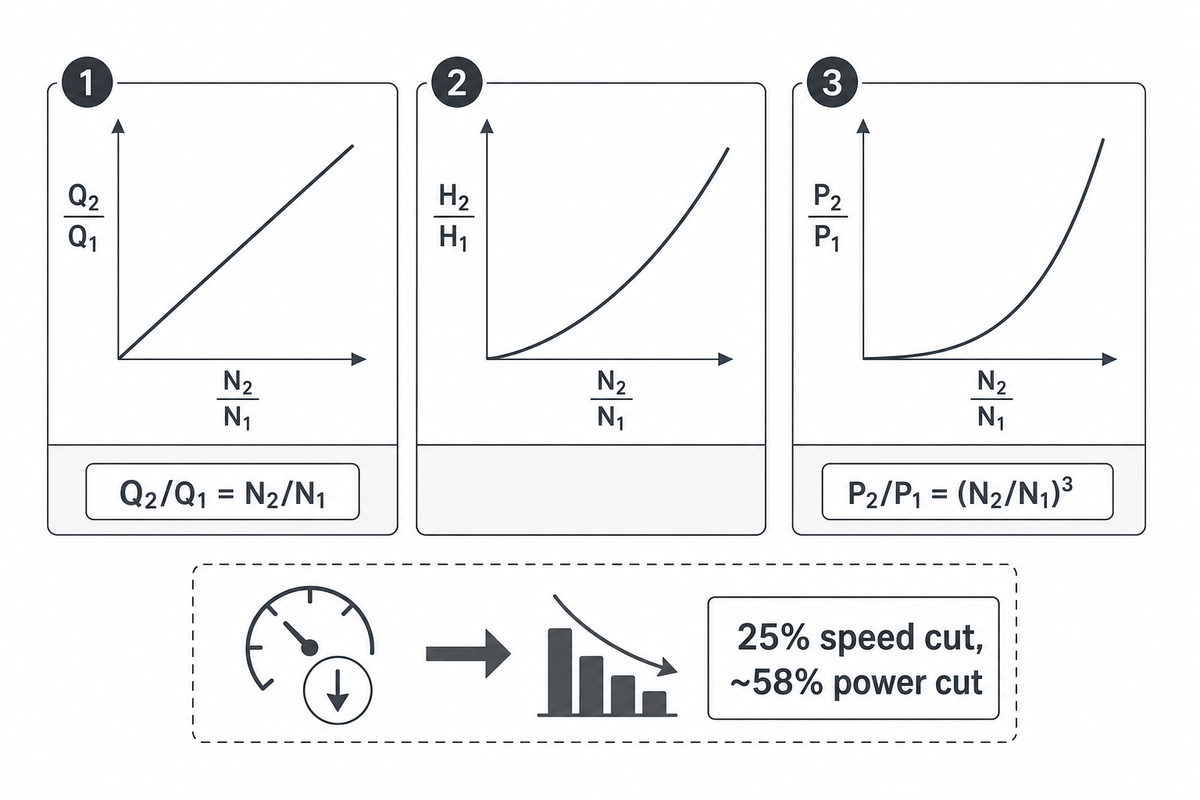
Cutting a pump’s speed by 25% with a variable frequency drive doesn’t cut power by 25% — it cuts power by roughly 58%, because power scales with the cube of speed while flow scales linearly and head scales with the square. This cubic relationship is why VFDs are such an effective energy-saving tool on variable-demand duty.
Q₂/Q₁ = N₂/N₁ H₂/H₁ = (N₂/N₁)² P₂/P₁ = (N₂/N₁)³
Per the Hydraulic Institute’s affinity rules (ANSI/HI 14.3), these relationships hold only under two conditions: pump efficiency stays roughly constant across the speed change, and the speed or impeller-diameter change is limited — extrapolate too far and the ratios won’t match what actually happens on the pump curve.
These pump affinity laws are also the tool for point in the pump curve questions more generally, not just the power ratio: changing the pump speed with a VFD shifts flow, head, and power together along the same underlying curve, which is why a speed change is usually a cleaner fix than throttling a valve.
📐 Worked Example
Take our 56.8 kW pump from earlier and slow it 25% (N₂/N₁ = 0.75) with a VFD: P₂/P₁ = 0.75³ = 0.422. New power = 56.8 × 0.422 ≈ 24.0 kW — a drop of almost 58% for a 25% speed reduction. BBP’s specific speed calculator covers the related question of how a speed or impeller change shifts a pump’s operating point on its curve.
From Calculated Power to Motor Nameplate kW, Safety Margin
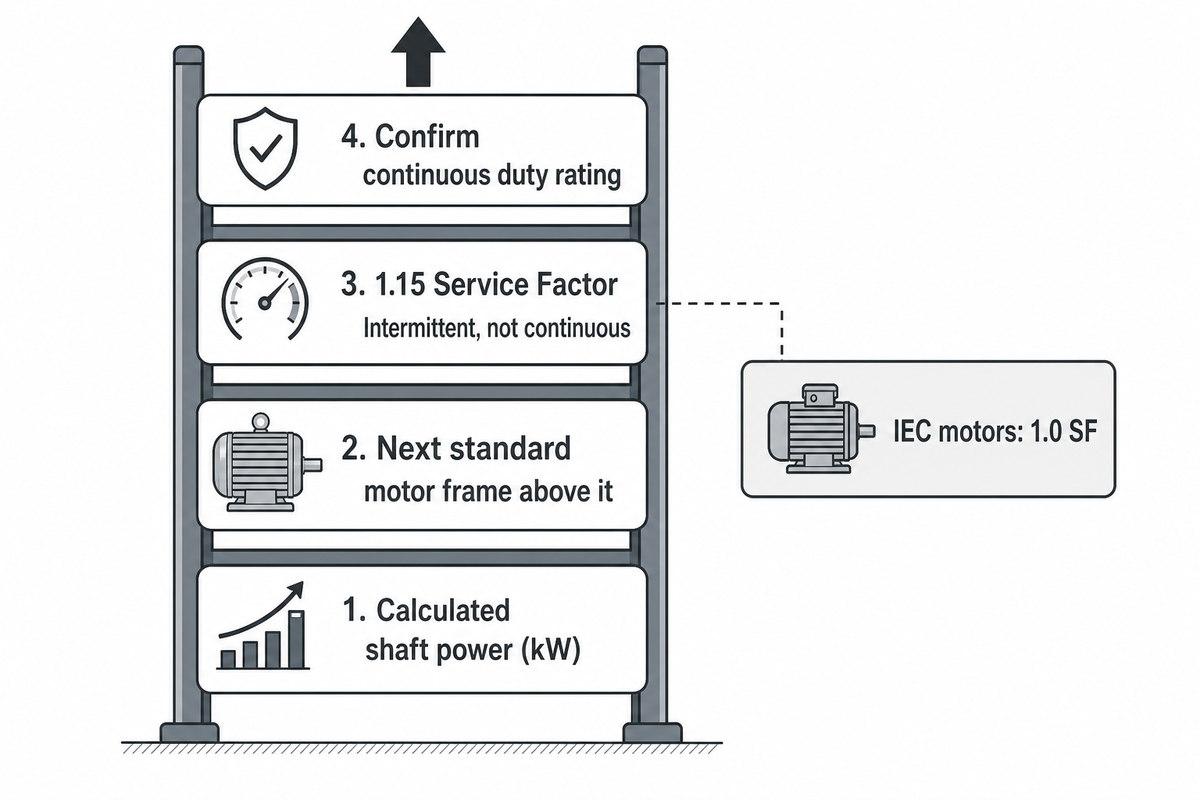
The shaft power number from the formula isn’t the motor rating you buy, standard practice is to select the next standard motor frame size above the calculated figure for continuous duty, rather than relying on a motor’s short-term overload capacity to cover the gap. On our 56.8 kW example, that typically means specifying a standard 75 kW frame rather than the nearest-below 55 kW frame, leaving genuine headroom instead of running at the edge.
NEMA MG-1 (Motors and Generators) defines a standard service factor (SF) of 1.15 for many general-purpose motors, a 10 HP motor with 1.15 SF can handle 11.5 HP intermittently without immediate damage. But service factor is overload capacity, not a continuous sizing allowance: running a motor continuously at its SF-rated load shortens winding and bearing life, and IEC-standard motors (common outside North America) typically carry only 1.0 SF with no overload margin at all, a real consideration for buyers sourcing motors across export markets. Think of it as The 15% Nameplate Headroom: a description of what a NEMA motor can briefly absorb, not a formula for how much bigger to buy.
A basic pump sizing calculation for motor selection starts with the shaft power in kilowatts or horse power, then works backward to confirm the required power sits comfortably below the frame’s continuous rating, not just its short-term overload ceiling.
| Duty Type | Sizing Approach | Why |
|---|---|---|
| Continuous (24/7 process) | Next standard frame above calculated shaft power, at 1.0 SF | Sustained SF-load operation shortens motor life |
| General purpose, intermittent | Standard 1.15 SF NEMA motor as headroom, not baseline | SF absorbs voltage sag, temperature swings, brief overload |
| Fan/blower-driven or export (IEC) | Confirm actual SF with the motor vendor before assuming 1.15 | IEC motors often ship at 1.0 SF; fan duty sometimes uses 1.25 |
The regulatory backdrop is moving toward tighter motor and pump efficiency requirements generally: the U.S. Department of Energy finalized a new energy conservation standard for circulator pumps in April 2024, with compliance required starting in 2028. That standard covers a specific class of residential and commercial circulator pumps and doesn’t directly regulate industrial slurry, sewage, or split-case fire pump lines, but it illustrates the direction pump and motor efficiency regulation is heading industry-wide, and DOE’s own modeling projects roughly 33% lower aggregate energy use across 30 years of covered-pump shipments versus a no-new-standards baseline. That’s a national shipment-weighted figure, not a per-unit efficiency claim for any single pump.
For a pump and drive package built around a diesel engine instead of an electric motor, the energy required by a pump doesn’t change, only the unit converting that shaft power into torque does, so the same power requirement carries over into a different sizing table entirely. Diesel-driven pumps (common on fire protection and remote irrigation duty) size differently, fuel consumption and engine curves replace motor nameplate kW as the sizing reference. BBP’s diesel-vs-electric TCO calculator compares the two driver types on a five-year cost basis.
Real-World Factors the Pump Power Formula Assumes Away
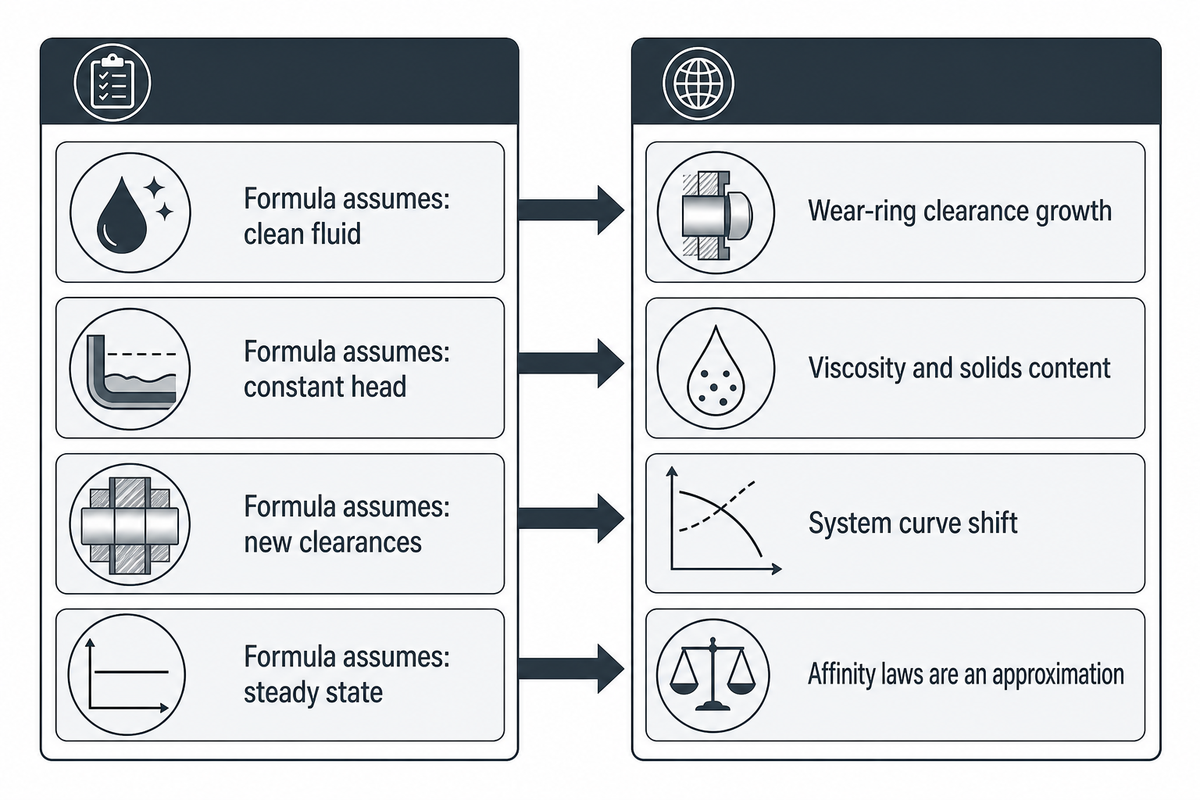
The formula on this page assumes a clean, single-phase, Newtonian fluid moving through a system whose head doesn’t change over the pump’s service life, none of which holds exactly true in the field, which is why a measured power draw and a calculated one rarely match to the decimal point.
- ⚠ Wear-ring clearance growth. As internal clearances open up with service hours, internal recirculation increases and measured power drifts upward at the same duty point, a pump that matched its calculated power at commissioning may not five years later.
- ⚠ Viscosity and solids content. The formula’s SG term captures density but not viscosity or suspended solids; per the Hydraulic Institute, liquid viscosity independently affects head, flow, efficiency, NPSH required, and power (ANSI/HI 9.6.7) — a real factor for slurry and sewage duty, where clean-water curves need a correction, not a straight read.
- ⚠ System curve shift. Scale buildup, partially closed valves, or piping changes move the system curve over time, shifting the pump’s actual operating point away from the one used in the original calculation.
- ⚠ The affinity laws are an approximation, not an exact law. A cited U.S. patent on sensorless pump-flow determination notes in its background discussion that the affinity-law power ratio “frequently results in an over or under estimation of power” depending on operating speed, pump size, and specific speed, useful for planning, not precise enough for fine-tuned energy audits without a correction.
None of this means the formula is wrong, it means a measured-vs-calculated mismatch is a normal diagnostic starting point, not proof of a math error. Check wear, viscosity, and system-curve drift before assuming the formula failed you.
Key Factors to Consider
- Use your pump’s actual curve for η, not a textbook default
- Compute total dynamic head, not just static lift
- Check NPSH margin as a separate step from power
- Size the motor to the next standard frame, not calculated power plus a flat percentage
Frequently Asked Questions
Q: What is the formula for pump power?
Pump power in kW equals flow rate (m³/h) times head (m) times specific gravity, divided by 367 times pump efficiency, with the imperial equivalent using GPM, feet of head, and a divisor of 3960 instead.
In US units the same relationship reads P (HP) = Q (GPM) × H (ft) × SG ÷ (3960 × η). This gives hydraulic power, the theoretical energy delivered to the fluid, not the shaft power a driver needs to supply, which is hydraulic power divided by pump efficiency again. See the worked example above for both unit systems computed from the same duty point.
Q: How do I calculate the horsepower of a pump?
Multiply flow in GPM by head in feet by specific gravity, then divide by 3960 times pump efficiency to get brake horsepower, the shaft power the pump itself draws before accounting for motor efficiency losses.
That gives brake horsepower (BHP) — the shaft power the pump itself requires, not what the driver draws from the wall. If you need motor input power instead, divide BHP by motor efficiency as a separate step; the two efficiencies multiply together rather than average, so mixing them up understates the true electrical draw and can leave a breaker undersized.
Q: How many GPM is a 1 HP pump?
There is no fixed GPM-per-HP ratio, it depends entirely on the head the pump is working against and its efficiency, since flow and head trade off against each other for any given power rating.
A 1 HP pump might move over 200 GPM at 15 ft of head, or under 20 GPM against 150 ft, at the same efficiency, flow and head trade off against each other for a given power rating, so there is no single fixed ratio between horsepower and GPM the way there is between, say, horsepower and watts. Rearranging the formula gives you GPM = HP × 3960 × η ÷ ft of head, which lets you solve for the flow your specific head and efficiency will actually deliver at 1 HP, instead of relying on a rule of thumb that only happens to hold for one particular head value and falls apart everywhere else. Always check the answer against your pump’s actual curve once you have it, since the formula assumes a fixed efficiency that only really holds near the best efficiency point.
Q: What is the power required for a centrifugal pump?
Shaft power for a centrifugal pump equals flow times total dynamic head times specific gravity, divided by 367 (metric) or 3960 (imperial) times the pump’s efficiency at that duty point.
Centrifugal pump efficiency at the calculation point typically runs 55-70% depending on size, up to about 94% for the most efficient units at their best efficiency point, pulling that number from your specific pump’s curve rather than assuming a round figure is what separates an accurate power estimate from a rough guess.
Q: What is pump power?
Pump power is the rate of energy transfer needed to move a fluid against a given flow rate and head, expressed as hydraulic, shaft, or motor input power depending on where in the system it’s measured.
It can mean hydraulic, shaft, or motor input power depending on where in the system you measure it.
Related Articles
- Pump Cavitation: Causes, Prevention, and What to Check First the NPSH-side companion check to this page’s power calculation
- Pump Standards Guide the ANSI/HI and NEMA standards cross-reference behind the citations on this page
- How to Write an RFQ for Industrial Pumps where a calculated power figure fits into a real vendor request
- Slurry Pump Total Cost of Ownership how motor sizing choices compound into five-year operating cost
References & Sources
- Pump Curves, Head, Power, Efficiency, NPSHR vs. Flow Hydraulic Institute Data Tool
- The Basics of NPSH & Pump Operating Regions Hydraulic Institute (Peter Gaydon, Deputy Executive Director)
- Understanding the 2024 Updates to ANSI/HI 9.6.1 Hydraulic Institute (Alex Moser, Senior Engineer of Standards and Training)
- Calculate Hydraulic and Shaft Power for Pumps Engineering ToolBox
- How to Define & Measure Centrifugal Pump Efficiency: Part 1 Jim Elsey, Pumps & Systems
- 13 Common Mistakes of Incorrect Pump Selection North Ridge Pumps
- Why NEMA Motors Use 1.15 Service Factor Industrial Monitor Direct
- DOE Finalizes Four Consensus-Based Efficiency Standards U.S. Department of Energy
- US Patent 7,945,411 B2, Method for Determining Pump Flow Without the Use of Traditional Sensors USPTO / Google Patents
Why We Write This
BBP builds slurry, sewage, centrifugal, split-case fire, multistage, booster, deep-well, and irrigation pumps spanning small deep-well units up to 30,000 m³/h irrigation and drainage duty, so getting the power formula right the first time, before a motor gets ordered, is a question our own selection process runs on every single duty point. The worked examples on this page use the same metric and imperial cross-check we run internally, not just a formula lifted from a textbook.
Reviewed by the BBP technical team.