Get in Touch with BBP

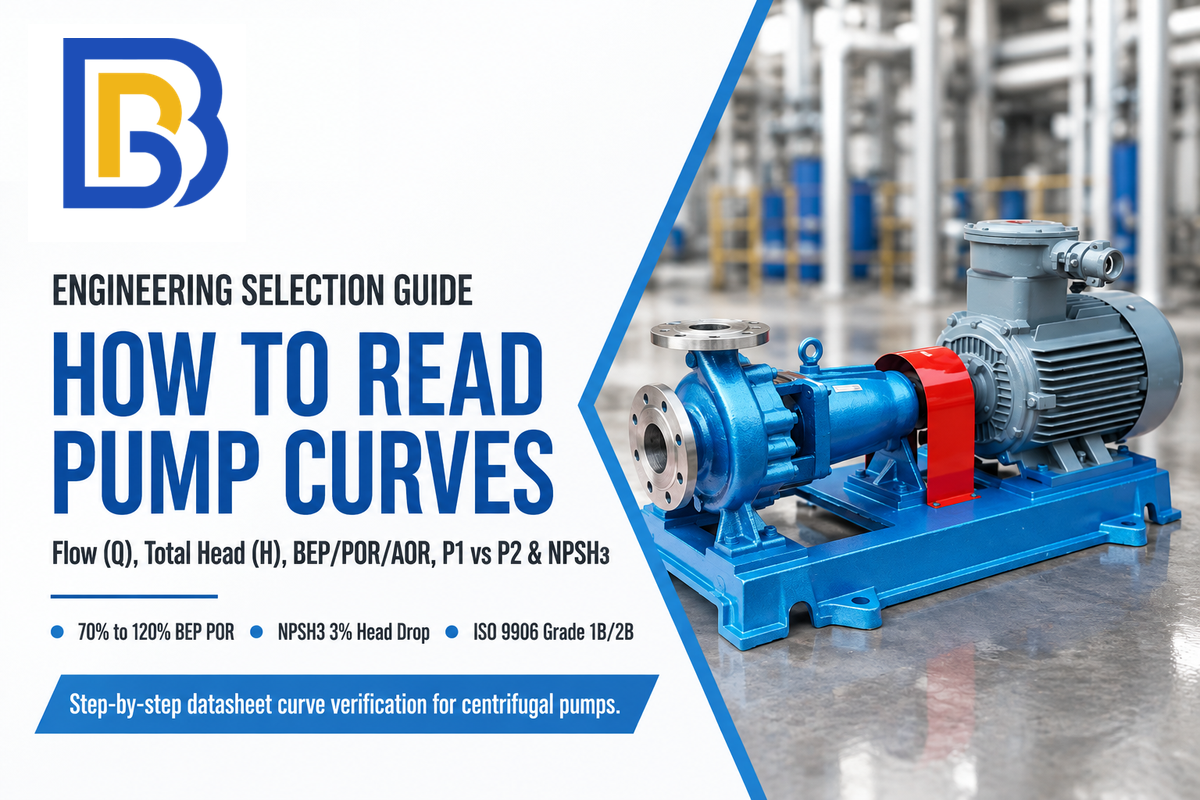
To read pump curves, start on the horizontal x-axis at 1 required flow rate (Q) and trace a vertical line across 4 hydraulic curves. Once the appropriate impeller diameter curve is identified, trace straight up to that curve to read total head (H) on the vertical y-axis. What the chart provides at that duty line includes outlet pressure head and the pump’s power demand. Next, read pump efficiency (η) and shaft brake horsepower (P2 or BHP) along that same flow line. Also read required net positive suction head, checking if the chart plots manufacturer stated NPSHR or tested 3%-head-drop NPSH3.
As documented in the Hydraulic Institute pump curve fundamentals, a single-speed catalog pump curve chart shows how a specific pump design performs at a stated rotational speed (RPM). Variable-speed datasheets instead plot multiple speed curves. ISO 9906:2012 and ANSI/HI 14.6-2022 cover factory performance testing with clean cold water (about SG = 1.0 and 1 cSt at 20°C). Always check the specific test liquid conditions printed in the datasheet header. Engineers who learn how to read pump curves use this alignment to select a pump that runs reliably without motor overload or suction cavitation. This chart is also used to determine overall pump and system efficiency across your operating range. Static lift and pressure losses in the system define the total head the pump can achieve at the duty point. If you need to calculate static head and pipe friction losses first, see our piping system resistance curve guide.
| Curve Line / Symbol | US Single-Grid vs EU 3-Panel Location | Standard Units | What the Curve Shows (Per the Standard) | Common Datasheet Misreading Trap |
|---|---|---|---|---|
| Head-Flow (QH Curve, Q vs H) | Main upper grid; Q on horizontal x-axis, H on left y-axis | GPM or m³/h (Q); feet or measured in meters (H) | Total dynamic pressure head delivered by the pump across its flow range | Selecting the maximum impeller diameter when future head reserve is needed |
| Efficiency Curve (ηp) | Iso-efficiency oval rings on US grid; middle panel on EU chart | Percentage of shaft power converted to water power | Shows the efficiency of energy transfer from the pump shaft to the fluid | Reading peak BEP efficiency instead of efficiency at the actual duty point |
| Power Curve (BHP / P2 vs P1) | Diagonal dashed lines on US grid; middle panel on EU chart | Horsepower (HP) or kilowatts (kW) | Mechanical shaft power (P2) or electrical power consumption (P1) on test water | Forgetting to correct water BHP for actual fluid density and viscosity |
| NPSH Curve (Stated NPSHR vs Tested NPSH3) | Lower band on US grid; dedicated bottom panel on EU chart | Feet or meters of liquid head above vapor-pressure head | Suction total head above liquid vapor-pressure head: tested NPSH3 marks a 3% first-stage head drop per the standard, while stated NPSHR (≥ NPSH3) reflects manufacturer margin guidance | Checking NPSH required only at design flow instead of maximum runout flow |
| Operating Range Markers (BEP, POR, AOR) | Tick marks, shaded bands, or vertical boundary arrows on H-Q line | Flow fraction relative to BEP flow rate per ANSI/HI 9.6.3 | Preferred and allowable flow boundaries where the pump can operate safely per the standard | Operating a pump continuously outside the manufacturer’s stated AOR boundaries |
How to Read a Centrifugal Pump Performance Curve Step by Step (Axes, Grid Layouts, and P1 vs P2)
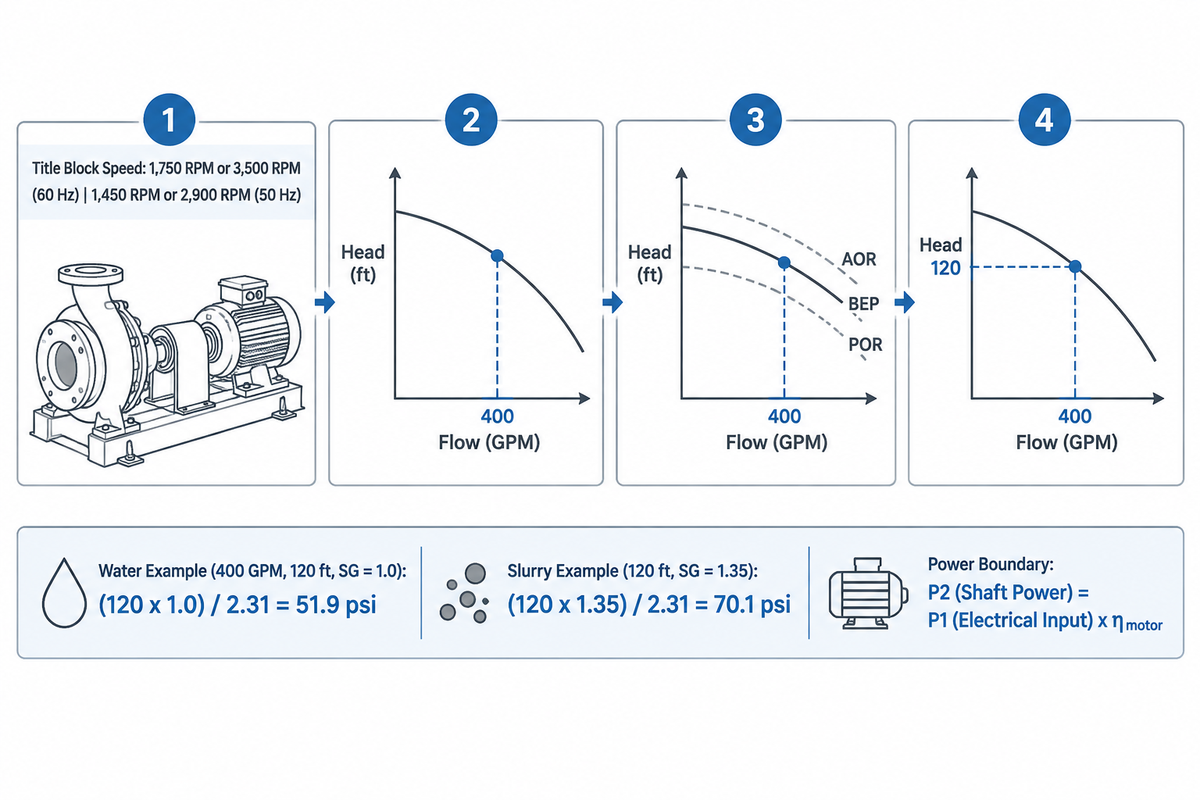
Accurately locate your required flow rate (Q) on the horizontal x-axis and draw a line straight up to the impeller diameter line that you’ve selected. From that intersection, read total head (H) on the left y-axis (converting head via ΔP [psi] = H [ft] × SG / 2.31 or ΔP [bar] = H [m] × SG / 10.197 while accounting for gauge elevation and velocity-head differences). Along that same vertical line, read overall pump efficiency (η), mechanical shaft power (P2 = P1 × η_motor at the motor input), and required suction head (stated NPSHR or tested NPSH3).
We call this method The Single-Vertical-Line Rule. Each graphical representation on a centrifugal pump datasheet locks flow and the pressure required to one horizontal flow coordinate. Reading peak efficiency at the best efficiency point (BEP) while reading head at a lower duty flow distorts motor sizing. Single-speed catalog curves apply to the shaft speed and test liquid conditions printed in the datasheet header and do not include site piping static lift or friction losses.
The 6-Step Vertical Alignment Method (Reading Flow and Head at Constant Q)
Strictly follow the six steps to select the right equipment or troubleshoot plant problems while reading the pump curves. Misreading impeller lines or using wrong power can cost you dearly in size selection errors.
- Step 1, Audit the datasheet title block: Read the pump model, casing size, test fluid basis, and shaft speed in RPM. Common synchronous motor speeds are 1,750 RPM or 3,500 RPM on 60 Hz power, and 1,450 RPM or 2,900 RPM on 50 Hz power. A fixed-speed pump curve applies only to the rotational speed printed in the title block.
- Step 2 – Find your required flow on the horizontal axis. Find your design flow rate on the horizontal x-axis in either US gallons per minute (GPM) or cubic meters per hour (m³/h). For either of these units, draw a straight line upward from the appropriate flow tick mark.
- Step 3- Intersect the H-Q curve to obtain total head: Stop where your vertical line intersects the solid curve for the impeller diameter of interest. Then read total head (H) by following the horizontal line to the left axis (feet or meters).
- Step 4, Convert total head to differential pressure for gauge checks: Where total head is fixed, the equivalent static pressure rise (ΔP) is directly proportional to the specific gravity. When checking total head against the suction and discharge pressure gauges, also take into consideration elevation and velocity-head differences between the gauge measurement locations.
ΔP (psi) = [H (ft) × SG] / 2.31 | ΔP (bar) = [H (m) × SG] / 10.197
Let’s say you have a pump head of 120 ft at a pump flow of 400 GPM on cold water (SG = 1.0). The pressure rise corresponding to 120 ft of head is (120 × 1.0) / 2.31 = 51.9 psi. When that same unit pumps mineral slurry with a specific gravity of 1.35 at 120 ft of head, the corresponding pressure rise increases to (120 × 1.35) / 2.31 = 70.1 psi.
- Step 5 – Read overall pump efficiency and shaft power at the same flow line: Read the pump’s efficiency (ηp) by interpolating between the iso-efficiency contour rings at the Q-H intersection. Then, find the brake horsepower (BHP) or kilowatt (kW) power curve at that flow coordinate.
- Step 6 – Drop down to the NPSH-curve at the bottom of the chart: Follow the flow line vertically into the lower suction panel. Distinguish tested NPSH3 (3% first-stage head drop per the standard) from manufacturer-stated NPSHR (≥ NPSH3) in the notes. Read the suction curve at both the operating flow and the maximum flow expected.
American Single-Grid Composite Curves vs European 3-Panel Stacked Curves
Industrial buyers typically see two standard graphical layouts when comparing global pump manufacturers. North American catalogs (Goulds, Cornell, ANSI chemical process datasheets, etc.) show a single, composite grid. Downward-sloping impeller trim lines, oval iso-efficiency islands, and diagonal dashed horsepower lines all sit on one coordinate plane. The single, composite grid shows the effect of trimming impeller on operating point in relation to iso-efficiency islands. However, a single grid can lead to visual interpolation mistakes due to the closeness of the lines.
European IEC and ISO datasheets (e.g. a Grundfos pump or a KSB catalog sheet) separate these variables into three vertically stacked panels. All three panels have a synchronized horizontal flow axis. The top panel shows QH curve (head vs. flow). The middle panel plots the efficiency curve alongside electrical or mechanical power in kW. The bottom panel shows the NPSH curve in meters. Drawing one vertical line from top to bottom lets you read flow and pressure, efficiency, power, and suction demand without visual clutter.
Decoding P1 vs P2 on a Pump Curve (Electrical Input vs Shaft Power and Pressure Gauges)
What P1 and P2 mean on close-coupled or variable-speed European pump curves is a common question among engineers. On electrically driven pump charts, P1 indicates active electrical input power (in kilowatts). When P1 is measured at the motor input terminals, mechanical shaft power is P2 = P1 × η_motor. When P1 is measured upstream of the variable frequency drive (VFD), shaft power is P2 = P1 × η_drive × η_motor. In this case, P2 is mechanical shaft power at the coupling and hydraulic power is P_hydraulic = P2 x ηpump.
At the motor terminals: P2 (Shaft Power) = P1 (Electrical Input) × η_motor. Upstream of the VFD: P2 = P1 × η_drive × η_motor. Hydraulic power: P_hydraulic (Water Power) = P2 × η_pump.
When a catalog curve shows P2, it defines the mechanical shaft power requirement that the motor rating must cover across the required operating envelope. When a canned motor pump or integrated VFD circulator curve plots P1, it shows electrical power consumption at the specified measurement boundary (motor input or VFD input). On factory test-stand piping schematics, Mantosh Bhattachraya’s January 2026 Notes on Centrifugal Pump Testing (ResearchGate) show that factory test stand schematics use P1 and P2 to label suction and discharge pressure gauges. His testing notes also report that Point 7 sits between rated flow and 105% of rated flow. ChemPumpSelect (API 610 13th Edition review) further notes that API Standard 610 reached its thirteenth edition in June 2026, replacing the twelfth edition of 2021.
Reading Impeller Trim Families, Curve Slopes (Steep vs Flat), and Affinity Scaling
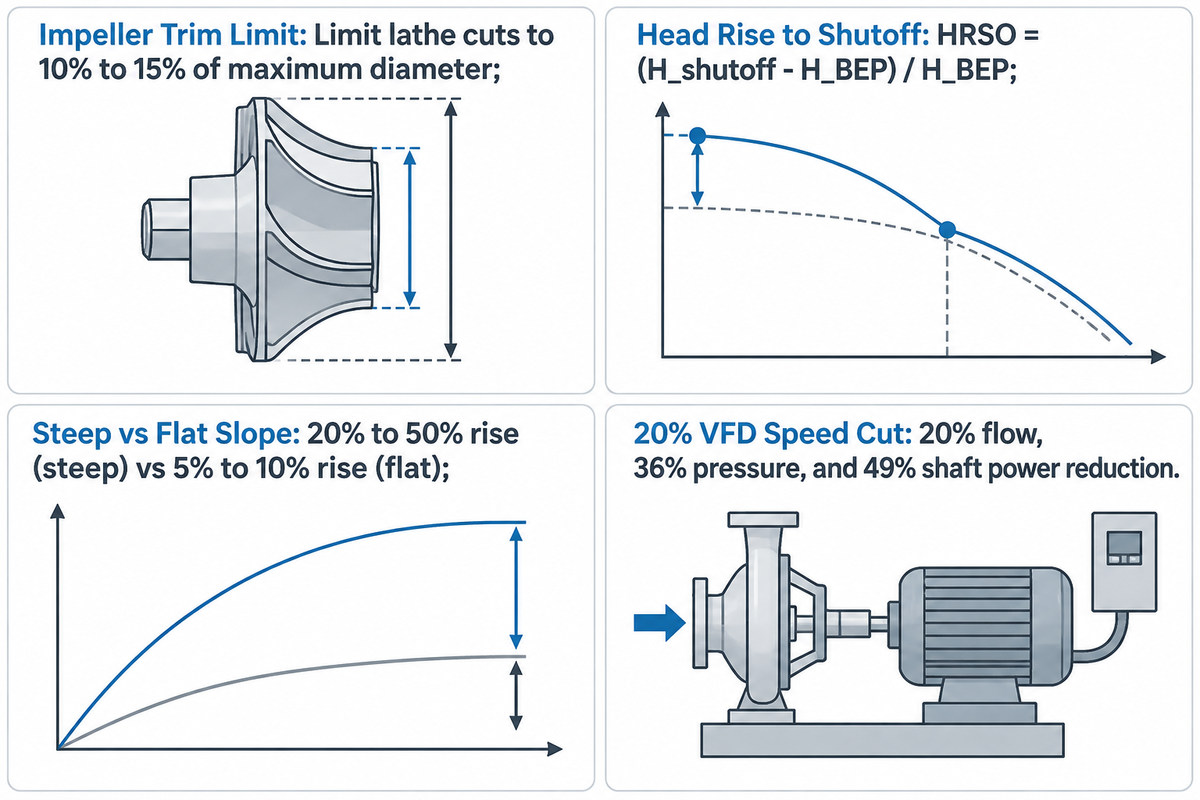
Multiple H-Q lines on one datasheet represent different machined impeller diameters inside the same pump casing. Selecting an intermediate impeller diameter below maximum trim preserves future head margin when expansion is planned. Limiting lathe diameter cuts to 10% to 15% of maximum diameter reported by DynaPro avoids steep efficiency loss and rising NPSHR. Meanwhile, a steep rising curve (20% to 50% head rise from BEP head to shutoff reported by Hydraulic Institute guidelines) versus a flat curve (5% to 10% rise from BEP head reported by Hydraulic Institute guidelines) governs parallel stability.
As DynaPro notes in its technical guide on centrifugal pump impellers (DynaPro), every pump curve is tied to a specific impeller design running at a specific speed. Variable-frequency speed changes shift corresponding curve points under the affinity laws at constant fluid density. The actual operating point in a piping system is determined where the reduced-speed curve intersects the system curve. By contrast, machining impeller diameters beyond 10% to 15% of maximum diameter reported by DynaPro increases tip-to-cutwater clearance. The resulting hydraulic efficiency loss is governed by specific speed (Ns) and casing geometry, and NPSHR can rise at a given flow.
Maximum vs Minimum Impeller Diameter Lines and Impeller Trim Margin
Pick an intermediate impeller diameter when future capacity or head reserve is required. A family performance chart shows parallel H-Q curves of a maximum 13.0-inch impeller trim down to a minimum 9.5-inch impeller trim. A duty point on the maximum impeller diameter curve doesn’t allow an increase in impeller diameter for a future head or flow requirement. Specifying an intermediate impeller trim allows greater capacity or friction increase to be accommodated by increasing the impeller diameter at a later time. As Intro to Pumps points out (Intro to Pumps), a motor sized only for a trimmed impeller has limited reserve. It isn’t always large enough to cover the power demand of the maximum diameter impeller.
Flat vs Steep H-Q Curve Slopes (Head Rise to Shutoff and Parallel Pump Stability)
The HRSO ratio of a pump curve quantifies how quickly it transitions from fully open to shutoff. According to the pump curve guidelines from the Hydraulic Institute, HRSO quantifies shutoff head at zero flow (H_shutoff) relative to the head at the best efficiency point (H_BEP).
HRSO = (H_shutoff − H_BEP) / H_BEP
Published Hydraulic Institute guidelines and refinery engineering practice classify centrifugal performance curves into three slope profiles across the hydraulic system:
- According to the Hydraulic Institute, steep rising curves result in a 20% to 50% head rise from BEP to shutoff. Large changes in system head result in small changes in flow rate. A rising head curve to shutoff supports stable parallel operation, along with balanced and controlled curves and instrumentation. Settling-slurry transport also requires keeping pipeline velocity above the critical settling velocity to avoid solids deposition.
- It’s reported that flat curves exhibit a 5% to 10% head rise from BEP to shutoff, as reported by the Hydraulic Institute classifications. Head is relatively constant over a broad flow range. Flat curves suit single-pump closed hydronic loops with modulating zone valves, but they require careful matching in parallel headers. Parallel pumps with very flat curves, according to refinery practitioners in the field, reported on Eng-Tips, tend to fight one another. When the clearance between the wear rings on one of the units is greater than the other and/or slight differences in speed between the two units causes one unit to be weaker than the other, the stronger pump forces the weaker unit to minimum stable flow.
- Drooping or hump-backed curves reach peak head at an intermediate flow rate higher than shutoff head. When a drooping pump curve intersects a system curve at two flow rates, low-flow operation with modulating valves or compressible air pockets can trigger flow hunting and surge instability.
Impeller Diameter Trimming vs VFD Speed Control on the Pump Curve Chart
Engineers can shift a pump’s performance downward by machining the outer impeller diameter (D2 / D1) on a lathe. Alternatively, they can reduce shaft RPM (N2 / N1) with a variable frequency drive. Dynamic HVAC (Dynamic HVAC) reports a 20% flow reduction, 36% pressure reduction, and 49% ideal shaft power reduction from a 20% speed cut. Those figures describe corresponding curve points under the affinity-law assumptions with unchanged liquid density. In a piping loop with static lift, the actual operating point is set where the reduced-speed curve intersects the system curve. Kord Fire Protection (Kord Fire Protection) notes that NFPA 20 Section 4.8 updated in 2025 clarifies variable speed fire pump design controls and testing documentation.
Machining the impeller diameter to alter the pump’s performance provides greater radial clearance between the impeller vanes and the volute cutwater tongue. DynaPro and the US DOE pump guidance suggest that if the diameter of the pump is reduced by more than 10% to 15% of its maximum diameter, there can be recirculation of the fluid within the pump. Like diameter trim, the hydraulic loss of efficiency is specific to the pump. Trimming the impeller can also increase NPSHR at a given flow rate because that flow point is further towards runout on the smaller diameter curve.
Locating Best Efficiency Point (BEP), Preferred Operating Region (POR), and Allowable Operating Region (AOR)
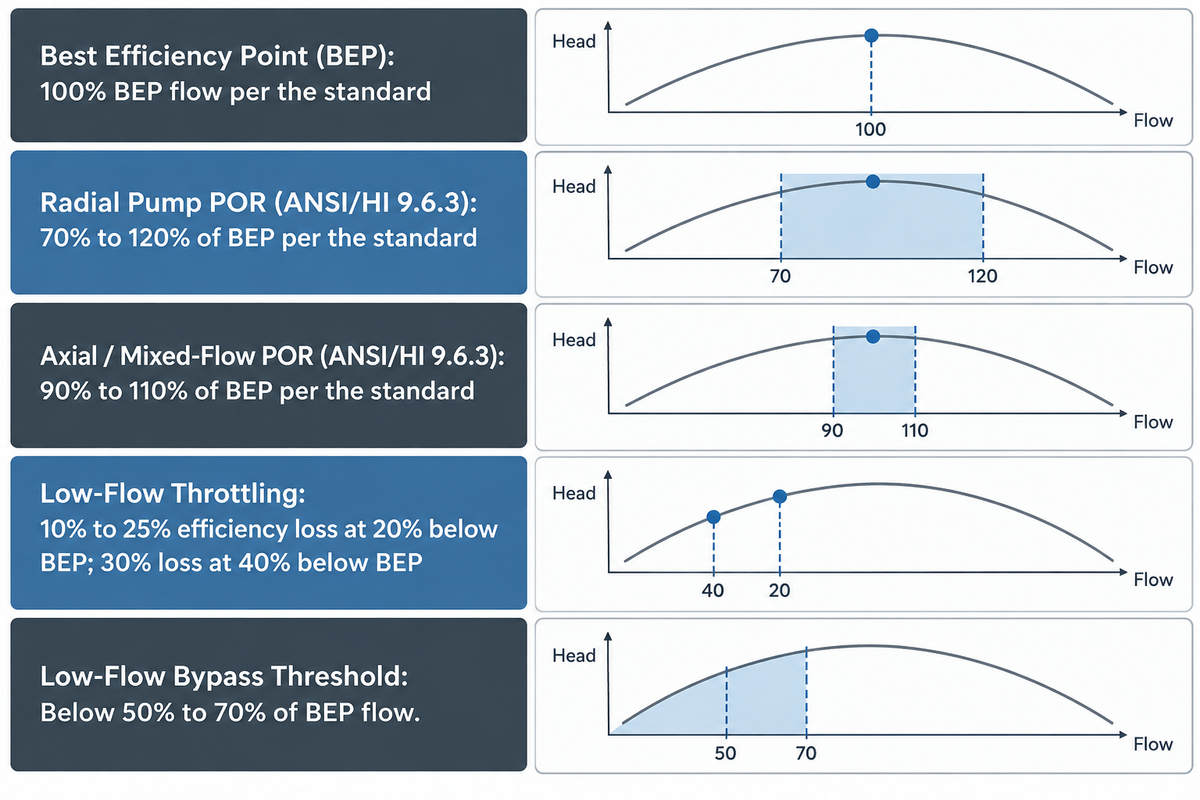
Under the ANSI/HI 9.6.3-2017 operating region guideline, rotodynamic pump selection places your normal duty point inside the Preferred Operating Region (POR) around the Best Efficiency Point (BEP). Low-specific-speed radial impellers have a POR of 70% to 120% of BEP flow per the standard, versus 90% to 110% for high-specific-speed pumps per the standard.
Continuous minimum, normal, and maximum operating flows must stay within the manufacturer’s wider Allowable Operating Region (AOR). Brief startup or shutdown transients may pass through shutoff or low-flow regions as permitted by the pump design. Following these boundaries when selecting the right pump ensures the right pump runs with minimal risk of cavitation. As OXMAINT analyzes in its report on Centrifugal pump curve, the location of the operating point in relation to BEP gives the best indication of hydraulic reliability.
Tracing Iso-Efficiency Loops and Finding the Best Efficiency Point (BEP)
On a composite pump curve, overall pump efficiency is plotted as nested horse-shoe contours, as shown in Hydraulic Institute catalog examples. Overall pump efficiency is the ratio of hydraulic water power delivered to the liquid divided by mechanical shaft power supplied at the pump coupling. For full step-by-step equations, see our centrifugal pump efficiency calculation breakdown. The peak of the innermost contour marks the Best Efficiency Point (BEP), where liquid enters the impeller vanes with minimal shock loss and balanced volute pressure. Hydraulic Institute 2026 data reported by HNT Pump (HNT Pump) shows that running 20% below BEP flow causes efficiency losses of 10% to 25% reported by HNT Pump. Operating 40% below BEP loses 30% or more of rated efficiency reported by HNT Pump.
Preferred Operating Region (POR) by Specific Speed Under ANSI/HI 9.6.3
The ANSI/HI 9.6.3-2017 standard defines Preferred Operating Region (POR) as the flow band centered on BEP. Within this band, hydraulic efficiency and operational reliability are not substantially degraded (HI Data Tool). Low-specific-speed radial pumps have a broad POR from 70% to 120% of BEP flow per the standard. High-specific-speed mixed-flow and axial-flow pumps have a narrower POR from 90% to 110% of BEP flow per the standard because their steep power and recirculation profiles penalize off-design operation.
| Operating Zone on Curve | Radial Pump Flow Band (Per the Standard) | High-Specific-Speed Axial Band (Per the Standard) | Hydraulic & Mechanical Behavior | Engineering Evaluation & Primary Risk |
|---|---|---|---|---|
| Best Efficiency Point (BEP) | 100% BEP flow per the standard | 100% BEP flow per the standard | Shockless vane entry; balanced radial volute pressure | Baseline bearing and mechanical seal service life |
| Preferred Operating Region (POR) | 70% to 120% of BEP per the standard | 90% to 110% of BEP per the standard | Low vibration and steady shaft deflection per the standard | Read the actual efficiency change from the selected pump curve |
| Allowable Operating Region (AOR) | Manufacturer Q_min,stable to upper AOR limit | Manufacturer Q_min,stable to upper AOR limit | Includes POR and extends to manufacturer-defined limits per the standard | Elevated radial thrust and recirculation; verify bearing and seal life |
| Low-Flow Bypass Threshold (OXMAINT) | Below 50% to 70% of BEP flow reported by OXMAINT | Below manufacturer Q_min,stable boundary | Suction and discharge eddy recirculation increases vibration | Install VFD or minimum-flow bypass line reported by OXMAINT |
| Severe Low-Flow Throttling (HNT Pump) | 20% to 40% below BEP flow reported by HNT Pump | Below 90% of BEP flow per the standard | 10% to 25% efficiency loss at 20% below BEP; 30% loss at 40% below BEP reported by HNT Pump | Excessive radial shaft deflection and seal face wear |
| Minimum Thermal Flow (Q_min,thermal) | Manufacturer thermal limit near shutoff | Avoid throttled low-flow operation | Brake horsepower converts to heat inside the pump casing | Liquid temperature rise and vapor flashing across mechanical seals |
| Shutoff Point (Zero Flow, Q = 0) | 0% flow per the standard (test point outside continuous AOR) | 0% flow per the standard (peak shaft power hazard on axial pumps) | Maximum pressure head on rising radial curves; peak BHP on axial propellers | Deadhead overheating, shaft breakage, or axial motor overload |
| Right of AOR (High-Flow Runout Zone) | Beyond manufacturer upper AOR flow limit | Beyond manufacturer upper AOR flow limit | Steep NPSH3 escalation and high brake horsepower draw on radial pumps | Impeller cavitation erosion and motor overload trips |
Reading the Allowable Operating Region (AOR), Minimum Flow, and API 610 Multi-Point Boundaries
The wider Allowable Operating Region (AOR) includes the POR and extends outward to the manufacturer’s minimum and maximum allowable continuous flows. National Pump Company reviews these limits in its guide to ANSI/HI 9.6.3 (National Pump Company). The left boundary of the AOR is Minimum Continuous Stable Flow (Q_min,stable), which is set by suction recirculation, vibration, and shaft deflection. Do not confuse Q_min,stable (governed by recirculation and vibration) with Minimum Continuous Thermal Flow (Q_min,thermal), which prevents excessive liquid temperature rise and flashing inside the casing. Patent filings such as US9441637B2 show how casing splitter ribs positioned at a distance L between 1.4s and 6s stabilize the head curve. Similarly, CN102678617B links Q, H, and NPSH testing directly to BEP verification.
In the heavy process industries, factory witness testing verifies performance at multiple points. Identify the factory test points and the manufacturer’s allowable operating limit, and distinguish shutoff testing from normal continuous operation. API 610 factory testing practices, reviewed in Hydrocarbon Processing and Inspenet, cover power, seal, stuffing box, rotating element, and pinion bearing tests. Refinery test protocols ensure performance from shutoff to the upper allowable limit.
Reading Brake Horsepower (BHP / P2), Non-Overloading Power Curves, and Specific Gravity or Viscosity Corrections
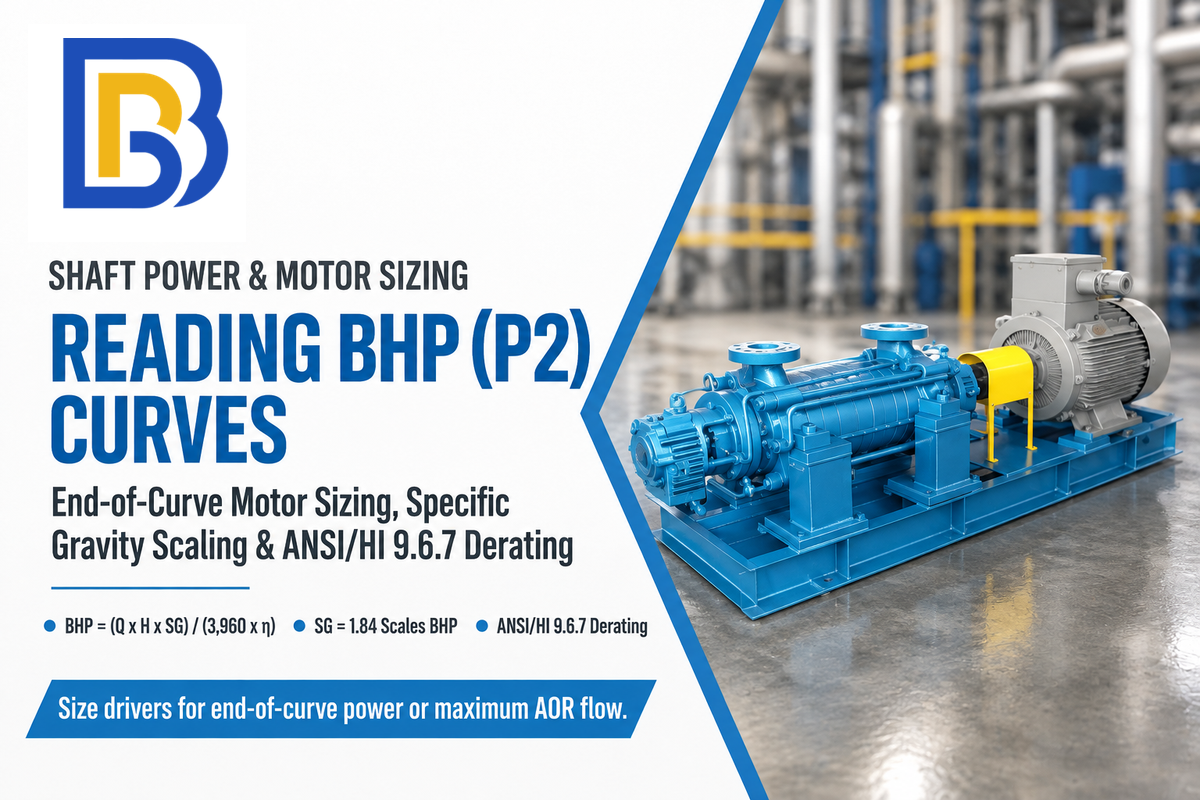
Manufacturer power curves plot shaft brake horsepower (BHP or P2) on the test liquid specified in the datasheet header. For homogeneous Newtonian liquids (1 to 4,000 cSt) in radial-flow pumps within the ANSI/HI 9.6.7-2021 allowable operating region, derate flow (Q_v), head (H_v), and efficiency (η_v) first. Calculate shaft power from those viscosity-corrected values and actual liquid density rather than dividing water BHP by C_η alone.
We refer to this hazard as The Runout SG-Viscosity Double Whammy. High specific gravity scales shaft power linearly across every flow point, while high viscosity alters flow and head and pump efficiency. Sizing a motor from design point power alone can result in undersizing if fluid-corrected power increases across the allowable operating region. ANSI/HI 9.6.7-2021 factors (C_Q, C_H, C_η) apply only to radial-flow pumps handling homogeneous Newtonian liquids within the AOR. They do not apply to non-Newtonian settling slurries.
Overloading vs Non-Overloading Power Curves Across Types of Pump
Different types of pump demonstrate varying slope curves for power as flow increases. Many low-specific-speed radial-flow centrifugal pumps (specific speed Ns of 500 to 3,000) have a power curve that’s lowest at shutoff (Q = 0) and rises toward runout. Non-overloading radial designs instead reach a peak and plateau or decline at high flow. When a radial pump has a rising power curve and system head drops, the operating point slides right toward higher flow and power draw increases. A non-overloading motor selection sizes the electric motor nameplate above the maximum fluid-corrected BHP anywhere along the selected impeller curve. High specific speed axial-flow pumps (Ns > 8,000) exhibit power curves that fall, with peak shaft power at shutoff. Axial flow pumps are susceptible to being overloaded if the motor isn’t sized for shutoff, especially if the discharge valve is throttled.
Correcting Water-Curve BHP for Specific Gravity and Viscosity Derating (ANSI/HI 9.6.7)
As per ANSI/HI 9.6.7, viscosity correction derates water flow (Qv = Qw CQ) and water head (Hv = Hw CH). It also derates water pump efficiency (ηv = ηp Cη). Write the US customary or metric shaft power equation using those viscosity corrected values and then substitute your datasheet values.
For viscous service, BHP = Q_v × H_v × SG / (3960 × η_v), where Q_v is in US GPM and H_v is in feet. In metric units, P2 (kW) = ρ × g × Q_v × H_v / (3.6 × 10^6 × η_v), where ρ is in kg/m³, Q_v is in m³/h and H_v is in meters. Here, η_v = η_p × C_η, and Q_v and H_v are the flow and head on the viscosity-corrected curve.
P2 (kW) = [Q_v (m³/h) × H_v (m) × SG] / (367.2 × η_p × C_η).
Follow this two-stage worked calculation to see why reading the clear-water power curve alone undersizes motors:
- Stage 1 (Datasheet Water Curve Reading): Read a pump curve at Q_w = 500 GPM, H_w = 140 ft, and pump overall efficiency η_p = 0.78 on the datasheet test basis (SG = 1.0, C_η = 1.0). Shaft power is (500 × 140 × 1.0) / (3960 × 0.78) = 22.66 HP, which fits within a standard 25 HP motor rating.
- Stage 2 (High-SG Viscous Brine): For a homogeneous Newtonian brine (SG = 1.35), ANSI/HI 9.6.7 nomographs yield C_Q = 0.95 (Q_v = 475 GPM), C_H = 0.96 (H_v = 134.4 ft), and C_η = 0.88 (η_v = 0.6864). Actual shaft power jumps to (475 × 134.4 × 1.35) / (3960 × 0.6864) = 31.71 HP at the derated 475 GPM / 134.4 ft point, requiring a 40 HP motor. Reaching the original 500 GPM at 140 ft in viscous service requires a larger impeller trim or higher speed.
If the pumped liquid is a non-Newtonian settling slurry rather than a homogeneous Newtonian oil or brine, then do not apply ANSI/HI 9.6.7. Settling mineral slurries require two-phase solids derating (HR and ER) as described in our factory tolerance section below. Heavy sump duties also couple high-service-factor motors with submersible agitated slurry pump configurations.
Pump Efficiency on the Curve vs Wire-to-Water Efficiency in the Plant
Discriminate the overall pump efficiency curve (η_p) shown on the vendor datasheet from total plant wire-to-water efficiency (η_wtw = η_p x η_motor x η_drive). May 2026 analysis by Mislier shows that the efficiency of most industrial water and wastewater centrifugal pumps is in the range of 50% to 85% at their Best Efficiency Point (BEP). As reported by Mislier, test-stand pump efficiency and plant wire-to-water efficiency differ for pumps of different sizes.
| Pump Type & Motor Rating | Pump Efficiency Range on Curve at BEP (Reported by Mislier) | Plant Wire-to-Water Efficiency Range (Reported by Mislier) | Primary Energy Loss Drivers |
|---|---|---|---|
| Small End-Suction (< 50 hp) | 50% to 70% (reported by Mislier) | 40% to 60% (reported by Mislier) | Wider relative casing clearance, friction, and smaller motor losses |
| Mid-Size End-Suction (50 to 200 hp) | 65% to 80% (reported by Mislier) | 58% to 72% (reported by Mislier) | Impeller trim gap, mechanical seal drag, and VFD harmonic losses |
| Large Double-Suction (> 200 hp) | 78% to 88% (reported by Mislier) | 70% to 82% (reported by Mislier) | Off-BEP throttling and wear-ring leakage over service life |
How to Read the NPSHR (NPSH3) Curve and Apply Safe Cavitation Margin Ratios
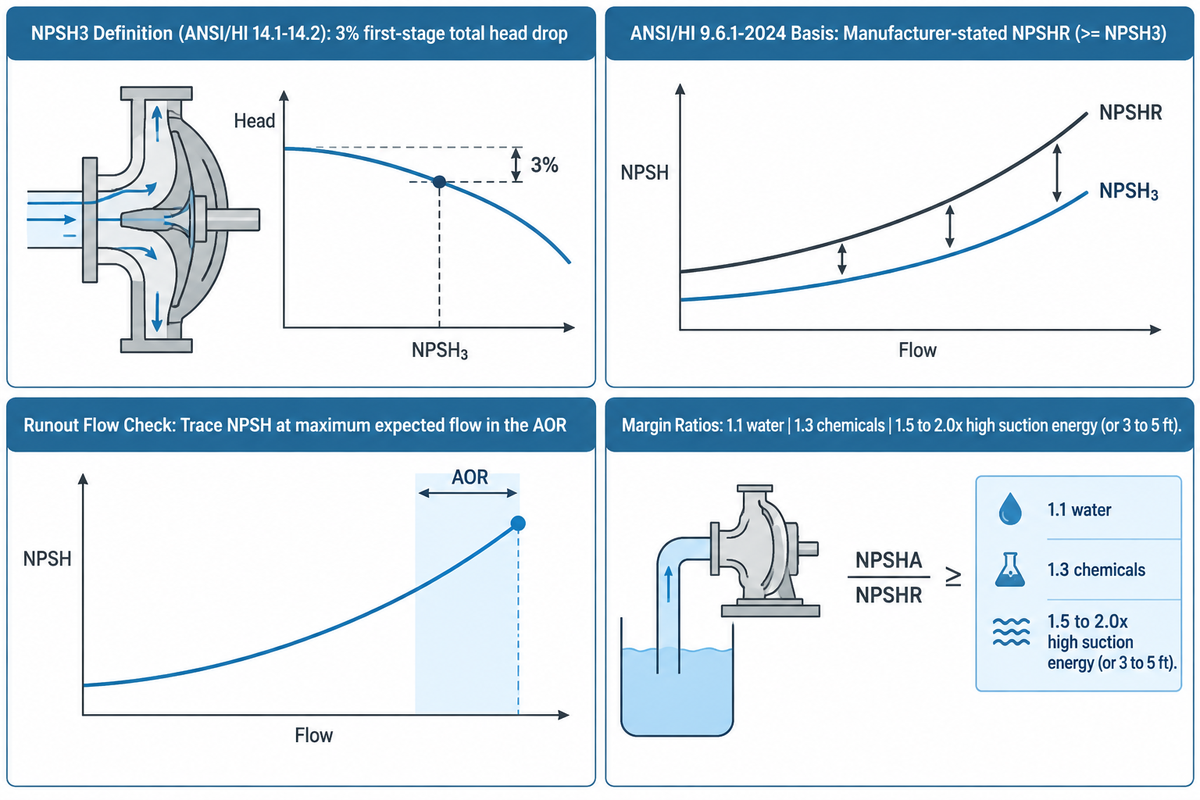
Available net positive suction head (NPSHA) must exceed required suction head across the entire operating range, including at minimum NPSHA and maximum expected flow. The manufacturer’s suction curve may show test NPSH3, as defined in ANSI/HI 14.1-14.2, by a 3% first-stage head drop. Under ANSI/HI 9.6.1-2024, it may instead show a manufacturer-stated NPSHR (NPSH required) line that is greater than or equal to NPSH3.
As described by Pump Power Australia in published vendor guidance, initial screening of NPSHA/NPSHR ratios are 1.1 for water, 1.3 for chemicals, and 1.5-2.0 for high suction specific speed. Final margin selection is made in accordance with ANSI/HI 9.6.1-2024 and accounts for suction specific speed, liquid properties, and full-range flow limits. Ignoring this margin is what we refer to as the NPSH3 Active-Cavitation Trap. At NPSHA equal to the tested NPSH3, cavitation has already reduced first stage head by 3% per the standard, and continued operation can damage the impeller. For Prevention of suction piping cavitation, see our centrifugal cavitation prevention guide.
Why Published NPSHR Often Plots NPSH3 (3% First-Stage Head Drop and ANSI/HI 9.6.1-2024)
The Table of Definitions from the Hydraulic Institute (HI Definitions ANSI/HI 14.1-14.2) states that NPSH3 is defined as the NPSHR where first stage total head drops by 3% due to cavitation. As explained in the NPSH and Cavitation Region Operating Zone analysis by Pumps & Systems, tested NPSH3 is commonly plotted against flow rate by pump manufacturers. ANSI/HI 9.6.1-2024 distinguishes manufacturer-stated NPSHR (≥ NPSH3) from raw tested NPSH3. From a pump operating perspective, NPSHA = NPSH3 indicates the pump is already losing 3% head to cavitation. The Testing commentary in Inspenet states that NPSH3 can be evaluated across multiple flow ranges in a multi-point testing protocol.
When looking at contemporary datasheets, engineers should also check whether the vendor follows the updated ANSI/HI 9.6.1-2024 guideline. Previous editions referenced cavitation margins directly to the tested NPSH3. With ANSI/HI 9.6.1-2024, the margin reference is to manufacturer stated NPSHR, where stated NPSHR is greater than or equal to NPSH3. Always read the datasheet footnotes to see whether the bottom suction curve plots raw tested NPSH3 or a vendor-adjusted NPSHR line.
Why You Must Read the NPSH Curve at Maximum Runout Flow, Not Just Design Flow
As flow rate increases from BEP toward the right-hand boundary of the AOR, liquid velocity accelerating into the impeller eye climbs rapidly. As the flow rate through your plant increases, the friction loss in the suction line increases as well, and NPSHA falls to a lower value. A pump that has adequate suction head margin at nominal BEP flow can cross below the plotted NPSH3 or stated NPSHR curve if the flow swings out to the upper AOR limit. Trace a vertical line at the maximum expected flow rate in the AOR to ensure NPSHA remains above the required suction curve.
Recommended NPSH Margin Ratios (NPSHA / NPSHR) by Service Severity
How much absolute pressure margin do you need on the suction side to suppress cavitation damage? PumpWorks (PumpWorks) recommends ensuring NPSHA exceeds NPSHR by a safety margin of 3 to 5 feet (1.0 to 1.5 meters) in general industrial service. Pump Power Australia (Pump Power Australia) reports vendor screening NPSH margin ratios (NPSHA ÷ NPSHR) of 1.1 for water, 1.3 for chemicals, and 1.5 to 2.0x for high-suction-energy service. Under ANSI/HI 9.6.1-2024, the NPSH margin assessment uses stated NPSHR across the full operating range. It accounts for liquid properties, suction specific speed (Nss), minimum NPSHA, and maximum expected flow to ensure the pump avoids cavitation damage.
Factory Acceptance Test Tolerances on Pump Curves: ISO 9906 vs ANSI/HI 14.6, API 610, and Slurry Derating
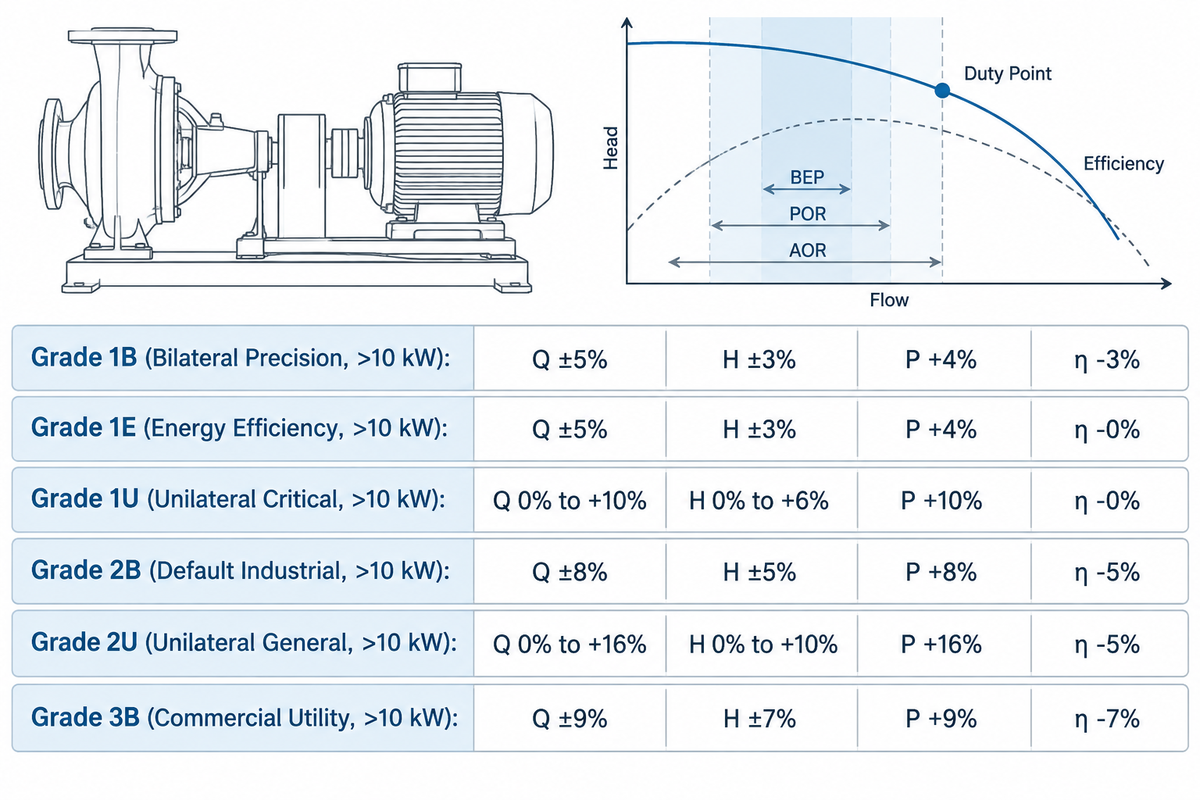
A published catalog curve is considered a nominal baseline, not a zero-tolerance line. Apply ISO 9906:2012 and ANSI/HI 14.6-2022 factory acceptance tolerances (Grades 1B, 1E, 1U, 2B, 2U, and 3B) at the guarantee point. These main-table grades govern calibrated test-stand acceptance for pumps with rated shaft power above 10 kW.
Small pumps with rated shaft power at or below 10 kW are governed by wider tolerances under ISO 9906 Annex A (±10% on flow and ±8% on head reported by Wilfley). Multi-point witness testing across the curve applies when specified in the purchase order. Settling mineral slurries (15% to 60% solids by weight and SG 1.25 to 1.65 reported by BBP Manufacturing Co., Ltd. heavy-duty horizontal and submersible slurry pump selection data) require Head Ratio (HR = 0.75 to 0.92) and Efficiency Ratio (ER) derating.
ISO 9906:2012 and ANSI/HI 14.6-2022 Acceptance Grades (1B, 1E, 1U, 2B, 2U, and 3B for Shaft Power > 10 kW)
During a Factory Acceptance Test (FAT), the test engineer plots at least six flow points from shutoff past the guarantee point, as described by Pumps & Systems (Pumps & Systems). Wilfley (Wilfley) notes that the default classification for chemical process pumps (ASME B73.1 or ISO 2858) is Grade 2B. For shaft power above 10 kW, Grade 2B allows a bilateral tolerance band of ±8% on flow, ±5% on head, and +8% on power or −5% relative tolerance on efficiency. Winston Engineering (Winston Engineering) specifies that Grade 1B tightens those bilateral bands to ±5% on flow rate, ±3% on head, +4% on power, and −3% on efficiency.
Our Unified 5-Standard Pump Curve Tolerance and Test-Point Comparison Matrix contrasts ISO 9906 / ANSI/HI 14.6 Grades 1B through 3B (for shaft power > 10 kW). It also compares API 610 (12th Edition), ASME B73.1-2026, and NFPA 20 / NFPA 25 fire pump curve checkpoints:
| Standard & Acceptance Grade | Flow Tolerance (t_Q per the Standard) | Total Head Tolerance (t_H per the Standard) | Shaft Power Tolerance (t_P per the Standard) | Efficiency Tolerance (t_η per the Standard) | Test Points & Scope (Per the Standard) |
|---|---|---|---|---|---|
| ISO 9906 / ANSI/HI 14.6 Grade 1B (Bilateral Precision, >10 kW) | ±5% per the standard | ±3% per the standard | +4% per the standard | −3% relative per the standard | Guarantee point acceptance for shaft power > 10 kW |
| ISO 9906 / ANSI/HI 14.6 Grade 1E (Energy Efficiency, >10 kW) | ±5% per the standard | ±3% per the standard | +4% per the standard | −0% per the standard | Guarantee point; forbids negative efficiency shortfall |
| ISO 9906 / ANSI/HI 14.6 Grade 1U (Unilateral Critical, >10 kW) | 0% to +10% per the standard | 0% to +6% per the standard | +10% per the standard | −0% per the standard | Guarantee point; zero negative flow or head tolerance |
| ISO 9906 / ANSI/HI 14.6 Grade 2B (Default Industrial, >10 kW) | ±8% per the standard | ±5% per the standard | +8% per the standard | −5% relative per the standard | Default hydraulic acceptance grade for ISO 2858 & ASME B73.1 pumps |
| ISO 9906 / ANSI/HI 14.6 Grade 2U (Unilateral General, >10 kW) | 0% to +16% per the standard | 0% to +10% per the standard | +16% per the standard | −5% relative per the standard | Unilateral positive band for general industrial service |
| ISO 9906 / ANSI/HI 14.6 Grade 3B (Commercial Utility, >10 kW) | ±9% per the standard | ±7% per the standard | +9% per the standard | −7% relative per the standard | Non-critical water transfer and HVAC circulators |
| ASME B73.1-2026 Chemical Process | Per ANSI/HI 14.6 grade in order (default Grade 2B ±8%) | Per ANSI/HI 14.6 grade in order (default Grade 2B ±5%) | Per ANSI/HI 14.6 grade in order (default Grade 2B +8%) | Per ANSI/HI 14.6 grade in order (default Grade 2B −5%) | Horizontal end-suction dimensional standard; hydraulic test per HI 14.6 |
| API 610 (12th Edition) Refinery / Process | Rated point evaluated per API 610 / HI 14.6 | ±3% at rated point per the standard; shutoff tolerance by Ns | +4% at rated point per the standard | Per contractual guarantee | Multi-point H-Q curve verification (including shutoff and rated point) and NPSH3 testing per API 610 and purchase order |
| NFPA 20 (2025) & NFPA 25 (2023) Fire Pumps | Tested at 0%, 100%, and 150% of rated flow per the standard | Shutoff ≤140% of rated head; ≥65% of rated head at 150% flow per the standard | Within driver rating across curve | No separate efficiency tolerance in NFPA 20/25 flow checkpoints (verify per listing and manufacturer curve) | Annual 3-point curve verification at 0%, 100%, and 150% rated capacity reported by Inspect Point |
Watch out for the relative percentage formula when reading efficiency tolerances under ISO 9906 Grade 2B. Under Grade 2B (−5% relative efficiency tolerance), a pump guaranteed at 80% efficiency passes factory acceptance if its measured efficiency reaches at least 80% × (1 − 0.05) = 76%, not 75%.
ASME B73.1-2026, API 610, and NFPA 20/25 Curve Verification Rules
Procurement specs often pair mechanical design codes with hydraulic curve standards. SAM Turbo (SAM Turbo) explains that API 610 is a mechanical design and construction standard for centrifugal pumps in petroleum and heavy-duty chemical service. API 610 references acceptable hydraulic and NPSH test methods, such as ISO 9906 or HI 14.6, alongside its own multi-point test and acceptance rules. Published specifications from ASME (ASME B73.1-2026) and ANSI Pumps Pro (ANSI Pumps Pro) show that ASME B73.1-2026 covers horizontal, end-suction single-stage, centerline-discharge chemical pumps. When replacing an existing ANSI process pump, agree on the duty and performance basis under ANSI/HI 14.6 in addition to ASME B73.1 dimensional fit.
In fixed fire protection systems, curve checkpoints are strictly enforced. Inspect Point’s summary of the 2023 edition of NFPA 25 (Inspect Point) notes that annual flow testing covers three curve points: no flow (0%), 100% of rated capacity, and 150% of rated capacity. Where the water supply or discharge arrangement makes 150% flow impossible, the standard allows testing to the maximum achievable flow with the limitation recorded. Global Market Insights (GMI) estimates that the fire pump test meters market size reached USD 350 million in 2025 and USD 369 million in 2026.
Reading Slurry Derating Curves (HR and ER) on Heavy-Duty Slurry Pumps
Why do heavy-duty mining and dredging datasheets show both a solid clear-water line and a dashed slurry line? Standard catalog curves reflect the datasheet clear-water test basis, whereas coarse mineral solids slip relative to the carrier fluid inside the impeller passages. In BBP Manufacturing Co., Ltd. heavy-duty horizontal and submersible slurry pump selection architecture for heavy-duty industrial slurry pumps, clear-water ISO 9906 curves are baseline references. BBP Manufacturing Co., Ltd.’s slurry-selection guidance reports a head ratio of HR = 0.75 to 0.92 for coarse settling slurries (15% to 60% solids by weight, SG 1.25 to 1.65, d50 0.15 to 2.5 mm). Here, HR = H_slurry / H_water and ER = η_slurry / η_water express head and efficiency ratios relative to water based on particle size, concentration, and geometry:
Head Ratio (HR) = H_slurry / H_water (0.75 to 0.92 reported by BBP settling-slurry selection for 15% to 60% solids by weight and SG = 1.25 to 1.65). Efficiency Ratio (ER) = η_slurry / η_water (evaluated from the slurry derating chart, based on d50 particle size, solids concentration and impeller passage geometry).
For high-specific-gravity (SG 1.25 to 1.65) mineral tailings and drainage applications, calculate required clear-water head as H_water = H_slurry / HR and derate overall pump efficiency by ER. At minimum curve flow, divide the volumetric flow by the pipe cross-sectional area to confirm that the slurry velocity is greater than the critical settling velocity (Vc) of the pipeline. Maintaining velocity above Vc reduces pipeline settling, although suction geometry and shutdowns can still cause solids accumulation.
8-Point Datasheet Curve Audit Checklist Before Approving a Vendor Pump Selection
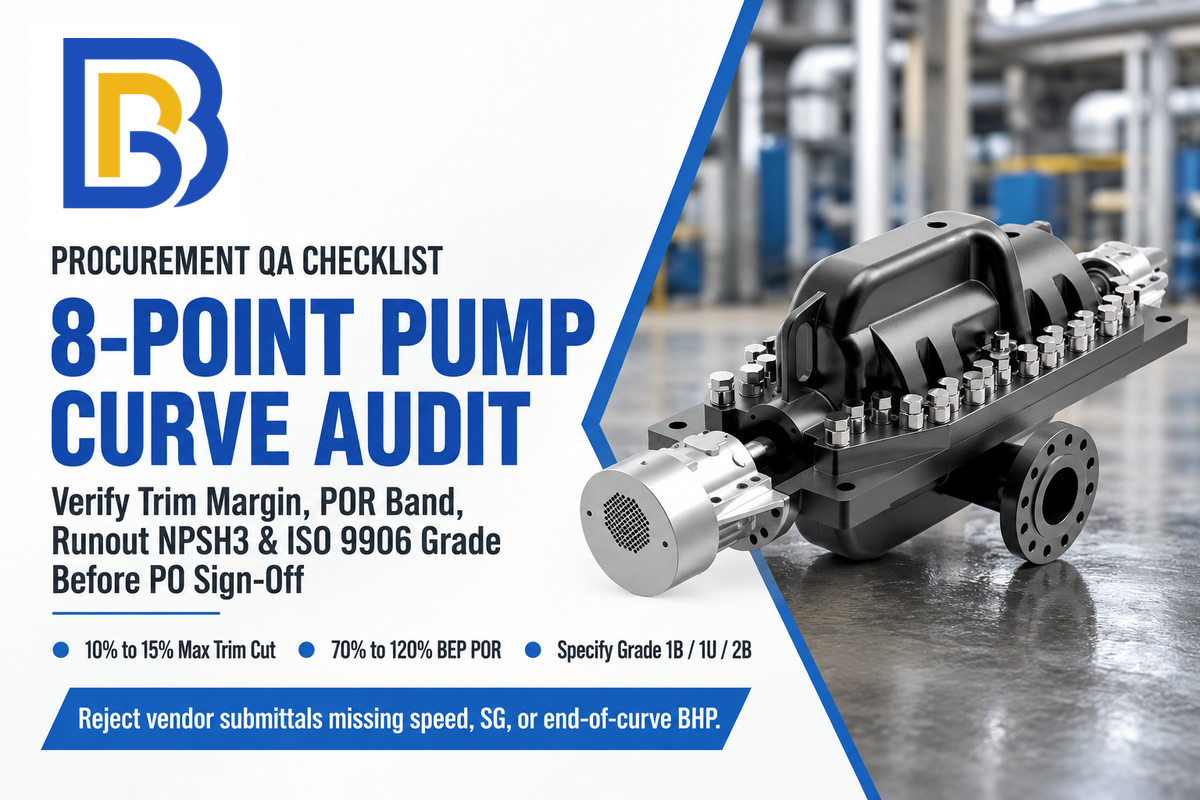
Before approving a vendor’s pump selection for manufacture, perform an eight-point engineering audit of the submitted pump curve. Check the header speed, BEP/POR placement, minimum stable flow, impeller trim margin, curve slope stability, maximum motor power, runout NPSH margin, and factory acceptance. Pair this checklist with our mine and industrial drainage pump selection guide for reliability.
| Audit Step | What to Read on the Pump Curve Chart | Engineering Pass Criterion (Per the Standard) | Rejection Trigger / Red Flag |
|---|---|---|---|
| 1. Title Block & Fluid Basis | Shaft RPM, 50/60 Hz frequency, fluid SG, and viscosity (cSt) | Matches plant motor pole speed and actual process fluid | 60 Hz curve submitted for a 50 Hz plant or unadjusted SG = 1.0 |
| 2. BEP & POR Placement | Normal duty point flow (Q_rated) vs Best Efficiency Point (Q_BEP) | Normal duty lies within the selected pump’s POR per ANSI/HI 9.6.3-2017 and manufacturer limits (70% to 120% BEP for low-Ns radial; 90% to 110% BEP for high-Ns per the standard) | Duty falls outside the applicable ANSI/HI 9.6.3 POR or agreed selection target |
| 3. Minimum Flow Boundary (Q_min) | Minimum continuous stable flow (Q_min,stable) and thermal flow | Turndown stays inside AOR; low-flow bypass prevents running below 50% to 70% BEP reported by OXMAINT | Continuous throttled operation left of Q_min,stable or below pipeline Vc |
| 4. Impeller Trim Margin | Selected impeller diameter vs maximum and minimum casing trims | Intermediate impeller diameter selected when future head or flow reserve is required | Maximum impeller diameter selected when the project specification requires future head margin |
| 5. Curve Slope & Parallel Stability | Head Rise to Shutoff (HRSO) from BEP to zero flow | Continuously rising curve with no droop that meets the agreed parallel-operation criterion (steep curves have 20% to 50% rise vs 5% to 10% for flat curves reported by Hydraulic Institute guidelines) | Drooping curve or mismatched flat curves in a common parallel pump header |
| 6. Motor Power (P2 / BHP) | Maximum corrected shaft power across the specified operating range | Motor rating covers the maximum specific-gravity and viscosity-corrected load (including shutoff on axial pumps) | Motor sized only at nominal water duty without checking the full operating range |
| 7. Maximum-Flow NPSH Margin | Tested NPSH3 or stated NPSHR at maximum expected operating flow | Meets ANSI/HI 9.6.1-2024 margin assessment across the full operating range (initial vendor screening ratios are 1.1 water or 1.3 chemical reported by Pump Power Australia) | NPSH checked only at design flow or NPSHA equals NPSH3 with zero margin |
| 8. FAT Grade & Slurry Derating | Purchase order test standard (>10 kW vs ≤10 kW) and slurry HR/ER overlay | Specifies ISO 9906 / HI 14.6 Grade 1B or 2B plus BBP slurry HR (0.75 to 0.92) and ER derating | Unstated test grade or slurry duty sized on uncorrected clear-water head and efficiency |
Frequently Asked Questions About Reading Pump Curves
What is P1 and P2 in a pump curve?
On European electrically driven pump performance curves, P1 represents active electrical input power in kilowatts (kW), and P2 represents mechanical shaft power at the pump coupling (BHP). At the motor terminals, P2 = P1 x η_motor; upstream of a VFD, P2 = P1 x η_drive x η_motor. On piping test schematics, P1 and P2 instead label suction and discharge pressure gauges, respectively.
What does a good pump curve look like?
Under ANSI/HI 9.6.3-2017 and manufacturer limits, a well-matched curve places normal duty inside the selected pump’s POR. That band spans 70% to 120% BEP flow for low-specific-speed radial pumps, or 90% to 110% for high-specific-speed pumps per the standard. It has a rising head slope, uses an intermediate impeller trim when capacity reserve is required, and keeps NPSHR margin across the AOR.
How do you check a pump performance curve in the field?
When a pump design permits throttling in the allowable operating range, record suction and discharge pressures and flow rate and motor power at two or more points. For differential pressure (ΔP in psi), convert to pressure-head difference in feet using 2.31 × ΔP / SG. Include elevation and velocity-head differences between gauge locations to compare total-head against the curve.
What is the difference between a pump performance curve and a system curve?
A pump performance curve shows the head a pump produces as flow increases from factory test data. By contrast, a system curve shows static elevation head plus piping pressure losses calculated by the plant engineer. The resistance curve follows H_system = H_static + K × Q², where H_static is tank lift plus tank pressure head. The operating point is the intersection of both curves.
Why does a pump curve show water performance when I am pumping chemicals or slurry?
Catalog curves reflect the specific test liquid and temperature stated on the datasheet (commonly clean cold water under ISO 9906 and ANSI/HI 14.6 procedures) to establish a reproducible baseline. Before operating the pump on viscous chemicals or settling slurries, engineers calculate fluid-corrected shaft power from actual liquid density. They also apply ANSI/HI 9.6.7 viscosity factors (C_Q, C_H, C_η) or settling-slurry Head Ratio (HR) and Efficiency Ratio (ER) derating.
References & Sources
- Hydraulic Institute Engineering Data Library Pump Curves: Head, Power, Efficiency, NPSHR vs Flow and Table of Definitions (NPSH3 per ANSI/HI 14.1-14.2)
- American National Standards Institute (ANSI) ANSI/HI 9.6.3-2017: Rotodynamic Pumps Guideline for Operating Regions (POR, AOR, and BEP)
- American Society of Mechanical Engineers (ASME) ASME B73.1-2026: Specification for Horizontal End Suction Centrifugal Pumps for Chemical Process
- ChemPumpSelect API Standard 610 13th Edition (June 2026) Technical Review
- Inspenet API 610 Standardization and 9-Point / 5-Point NPSH3 Testing Protocol
- Pumps & Systems Performance Testing of Centrifugal Pumps & The Basics of NPSH and Pump Operating Regions
- Wilfley & Winston Engineering Centrifugal Pump Testing Standards (Grade 2B Default) & How to Read a Pump Test Certificate: ISO 9906 Grades
- Mislier & Pump Power Australia Typical Centrifugal Pump Hydraulic vs Wire-to-Water Efficiency (2026) & NPSH Margin Ratios (Water vs API 610 Chemical Service)
- Inspect Point & Global Market Insights NFPA 25 Annual Fire Pump Flow Testing Requirements & Fire Pump Test Meters Market Analysis (2025-2026)
- US Patent & Trademark Office / Google Patents US9441637B2: Volute Casing Splitter Rib Geometry for Head Curve Stability & CN102678617B: Centrifugal Pump BEP and Cavitation Testing