Get in Touch with BBP

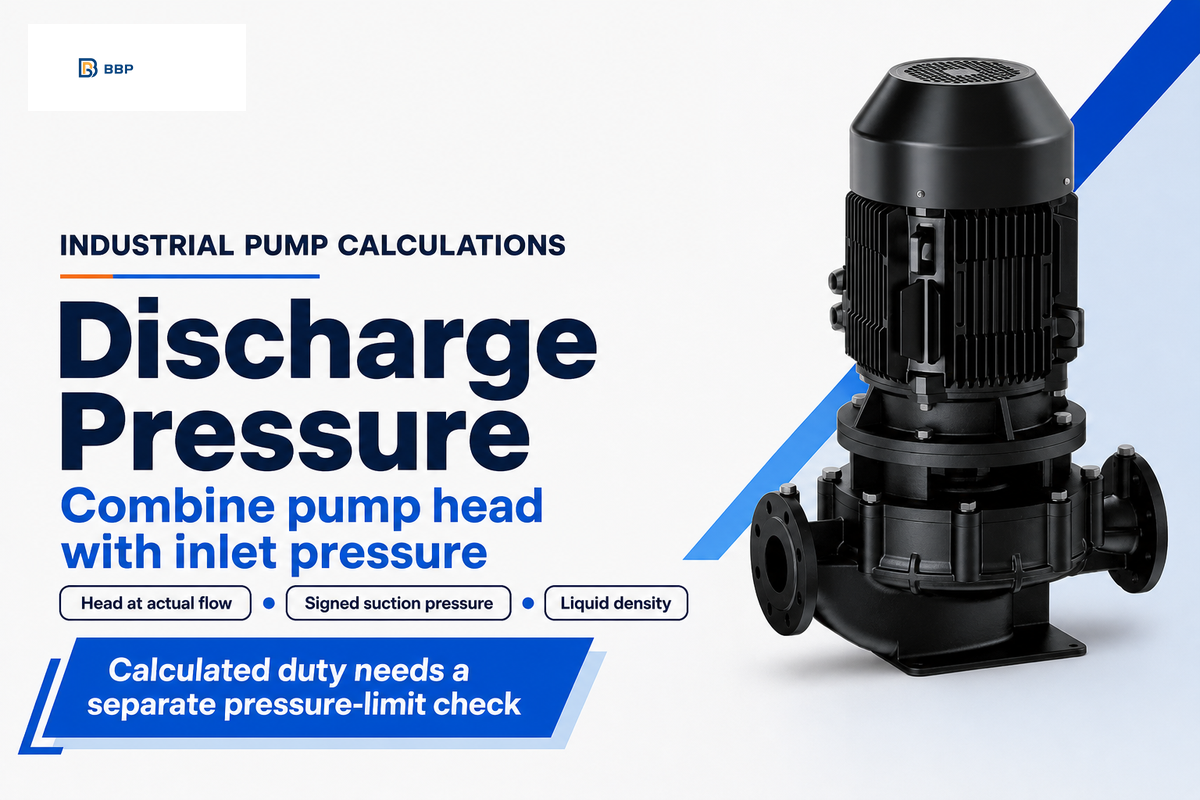
Pump discharge pressure calculation is an energy balance between pump inlet and outlet. Converting the pump head provides the pressure rise, which is then combined with the suction pressure. This analysis focuses on steady liquid flow through industrial centrifugal pumps and is illustrated through numerous examples and input records needed by the supplier for assessment.
Quick calculation inputs
- Pump head at the operating flow, speed and impeller diameter.
- Suction pressure, including its sign and gauge or absolute reference.
- Liquid density at operating temperature.
- Pressure-tap elevations and pipe inside diameters.
Pump discharge pressure calculation adds suction pressure to the pump’s pressure rise. With equal tap velocities and elevations, use Pd = Ps + 0.0980665 × SG × H for pressure in bar and head in metres. Keep one pressure reference and use head at the operating flow.
Key points
- Shutoff head isn’t necessarily the highest head on every pump curve.
- A negative suction gauge pressure keeps its minus sign.
- The same head produces different pressure rises in liquids of different densities.
- A calculated outlet pressure doesn’t establish the equipment’s allowable working pressure.
Separate pump head from discharge pressure
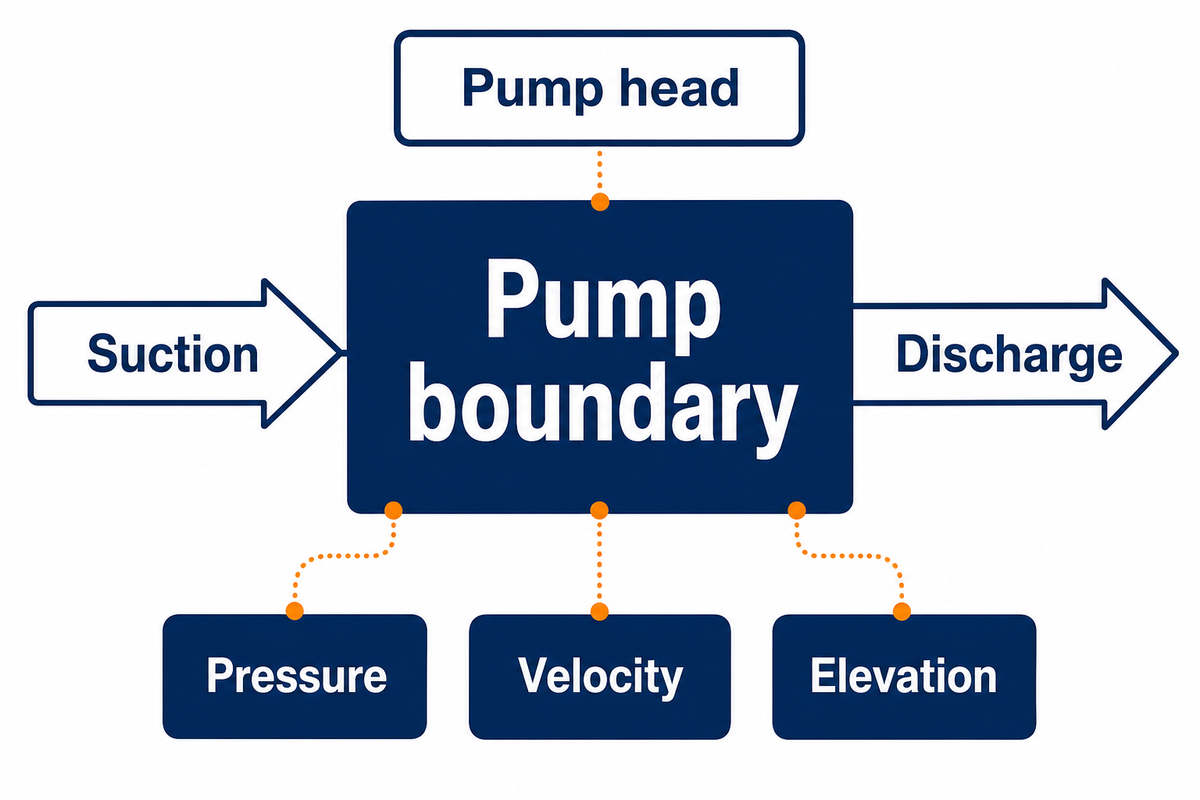
Discharge pressure is the outlet pressure. Differential pressure is the difference between outlet and inlet pressure. Pump head is the increase in energy per unit weight of liquid through the pump and consists of pressure, elevation and velocity components. Confusing either quantity can result in the wrong answer to a properly done unit conversion.
What is a pump head?
Pump head, expressed in metres or feet, is the increase in energy per unit weight of liquid. In a centrifugal pump curve, it pertains to a particular flow and pump configuration. It is not automatically the vertical height of the discharge pipe, nor is it the pressure shown by one outlet gauge.
The pump curve guide of the Hydraulic Institute uses both suction and discharge conditions to define the head across the pump. For steady incompressible flow, the energy relationship at the pump boundaries is:
H = (Pd − Ps)/(ρg) + (vd² − vs²)/(2g) + (zd − zs)
H: head in m; P: pressure in Pa; ρ: density in kg/m³; g: gravity in m/s²; v: velocity in m/s; z: elevation in m. Subscripts d and s mean discharge and suction.
H: head in m; P: pressure in Pa; ρ: density in kg/m³; g: gravity in m/s²; v: velocity in m/s; z: elevation in m. Subscripts d and s mean discharge and suction.
Use this relationship for specifically defined inlet and outlet pump sections. At a discharge point farther along the pipe, intervening friction loss and fittings can affect the reading, and should be corrected for comparison with a pump curve. The curve procedure doesn’t set pressure limits for positive-displacement pumps; this is covered in the pump-type explanation of the Hydraulic Institute.
Total head at the outlet is the discharge head; subtract the total suction head to obtain the pump’s differential head. The difference is known as total dynamic head. Keep the definition with the number because a data sheet may also provide the system head needed between more distant boundaries.
Calculate discharge pressure in bar or psi
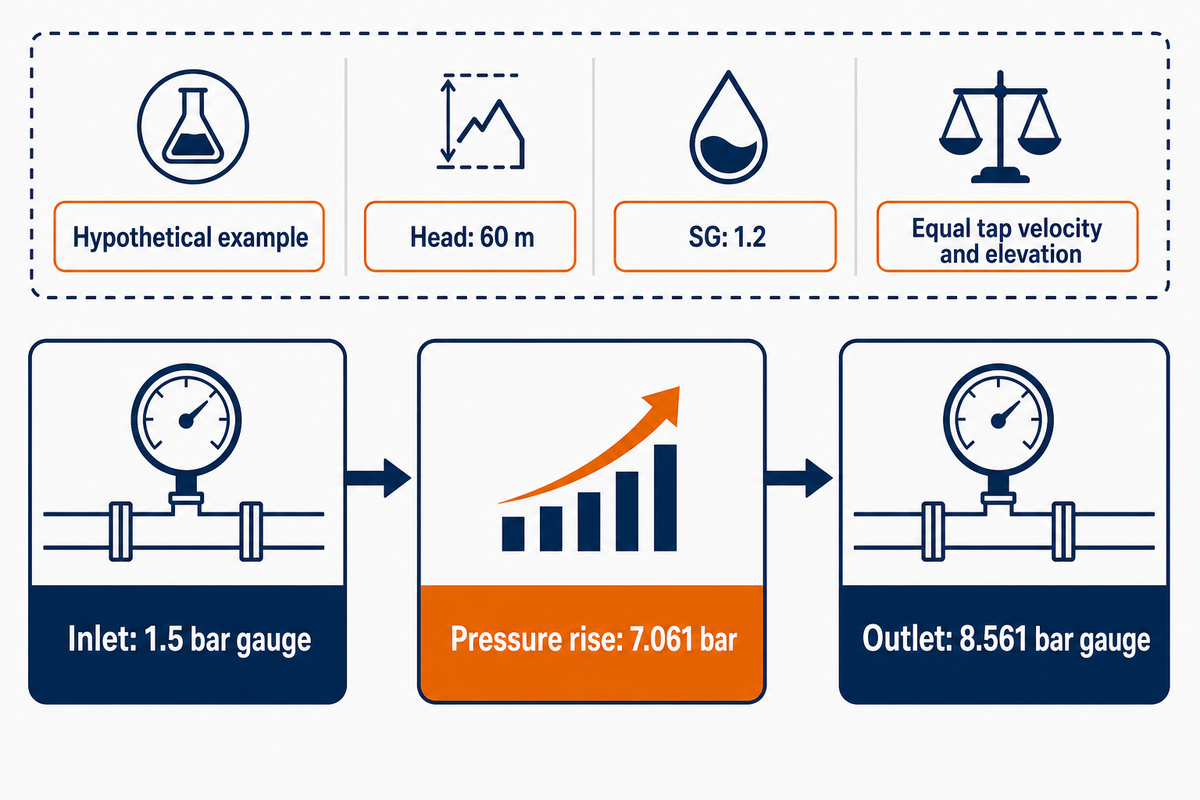
When inlet and outlet velocity heads and elevations balance, the rise of pump pressure is density multiplied by gravitational acceleration and head. Add this rise to suction pressure on the same reference basis. If those conditions do not hold, retain the correction terms in the full equation before converting pascals into another pressure unit.
How to calculate suction discharge pressure for a pump?
Use suction pressure as a signed input and take the pump head from the applicable curve at the operating flow. Convert that head into a pressure difference using the liquid density, then add the difference to the suction value. Both pressures must be in the same units and reference; don’t mix bar absolute with bar gauge.
ΔP (bar) = 0.0980665 × SG × H (m)
Pd (bar gauge) = Ps (bar gauge) + ΔP (bar)
For customary units: ΔP (psi) ≈ SG × H (ft) / 2.31.
Pd (bar gauge) = Ps (bar gauge) + ΔP (bar)
For customary units: ΔP (psi) ≈ SG × H (ft) / 2.31.
The metric coefficient uses standard gravity, 9.80665 m/s², and a reference density of 1,000 kg/m³. NIST’s unit-conversion tables give 100,000 Pa per bar and approximately 6,894.757 Pa per psi. For precise work, use the supplied liquid density directly; the reference-water convention must match the specific gravity value.
The rounded conversion factor is 0.0981 bar per metre at SG 1.0. Retain more digits during calculation and round the final answer. This formula is used to calculate pump discharge pressure from a known head; it doesn’t determine the size of a pump from pressure alone.
Suppose a supplier’s curve gives 60 m at your operating flow and speed. The liquid has SG 1.2 on the stated reference basis, and inlet pressure is 1.5 bar gauge. Assuming matching tap elevations and velocities, density is 1,200 kg/m³. The pressure rise is 1,200 × 9.80665 × 60 ÷ 100,000 = 7.060788 bar. Adding the inlet pressure gives 8.561 bar gauge, rounded. Reporting 7.061 bar as the outlet pressure would omit the pressurized supply. Sending both the inlet condition and the calculated outlet requirement lets the supplier check the same operating case.
| Head (m) | Pressure rise (bar) | Pressure rise (kPa) | Pressure rise (psi) |
|---|---|---|---|
| 5 | 0.49033 | 49.033 | 7.112 |
| 10 | 0.98067 | 98.067 | 14.223 |
| 20 | 1.96133 | 196.133 | 28.447 |
| 30 | 2.94200 | 294.200 | 42.670 |
| 40 | 3.92266 | 392.266 | 56.893 |
| 50 | 4.90333 | 490.333 | 71.117 |
| 60 | 5.88399 | 588.399 | 85.340 |
| 80 | 7.84532 | 784.532 | 113.787 |
| 100 | 9.80665 | 980.665 | 142.233 |
These are calculated pressure differences, not outlet gauge readings. Displayed digits help validate arithmetic and don’t indicate that a field instrument measures that precisely. Multiply by the corresponding SG and add suction pressure.
When measuring in gpm, check whether the unit means US gallons per minute before converting to SI units. Reading head correctly requires proper units on the horizontal axis and pressure conversion.
Compare three suction conditions
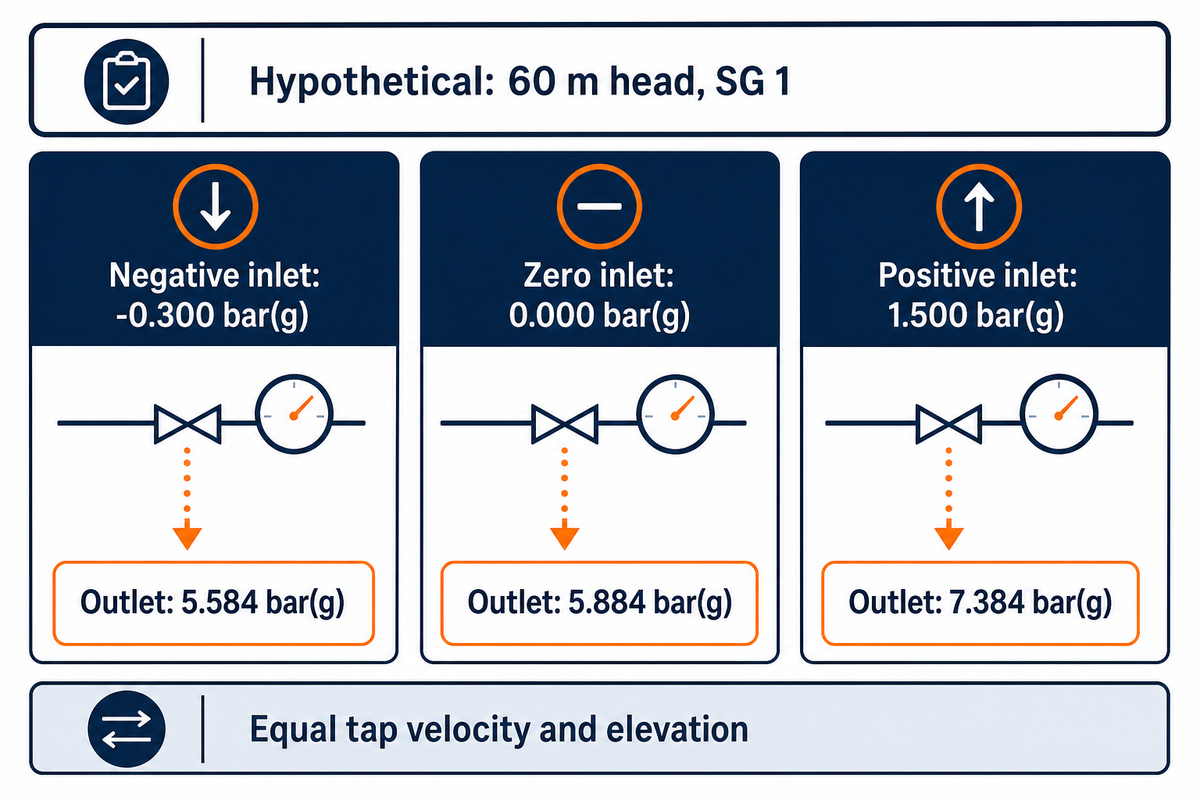
Inlet pressure differences result in variations of outlet readings for constant pump head. In each row, outlet pressure is calculated with the same head and density; variation of inlet pressure differences helps identify errors. These comparisons are based on principle rather than predicting that changing tank level will maintain operating flow unchanged.
3-Suction Pressure Ledger
The 3-Suction Pressure Ledger shows how differences in inlet gauge pressure result in changes of outlet pressure, holding head and density constant.
| Illustrative condition | Suction pressure, bar(g) | Pump pressure rise, bar | Outlet pressure, bar(g) |
|---|---|---|---|
| Negative inlet gauge reading | −0.300 | 5.884 | 5.584 |
| Zero inlet gauge reading | 0.000 | 5.884 | 5.884 |
| Pressurized supply | 1.500 | 5.884 | 7.384 |
Perform a quick check of a pump supplied from a tank below its inlet. If the inlet gauge reads −0.30 bar and the pump actually develops 60 m of head with the reference liquid, the calculation is −0.30 + 5.88399 = 5.58399 bar gauge. Reversing the sign would make the outlet pressure greater by 0.60 bar. A tank that’s open to the atmosphere doesn’t guarantee a zero pressure at the inlet of the pump. Liquid level, pipe losses in the suction, and the overall flow affect the reading. It’s important to define the point of inlet, and take the reading at that defined point, rather than taking the pressure above the liquid surface.
This arithmetic doesn’t prove adequate suction conditions. Local atmospheric pressure, liquid temperature and vapor pressure affect available net positive suction head. The Hydraulic Institute’s suction and performance guidance explains why a separate, application-specific margin assessment is needed. For pressurized supplies, booster pump applications require the inlet-pressure range as well as the required boost.
Correct for density and measurement location
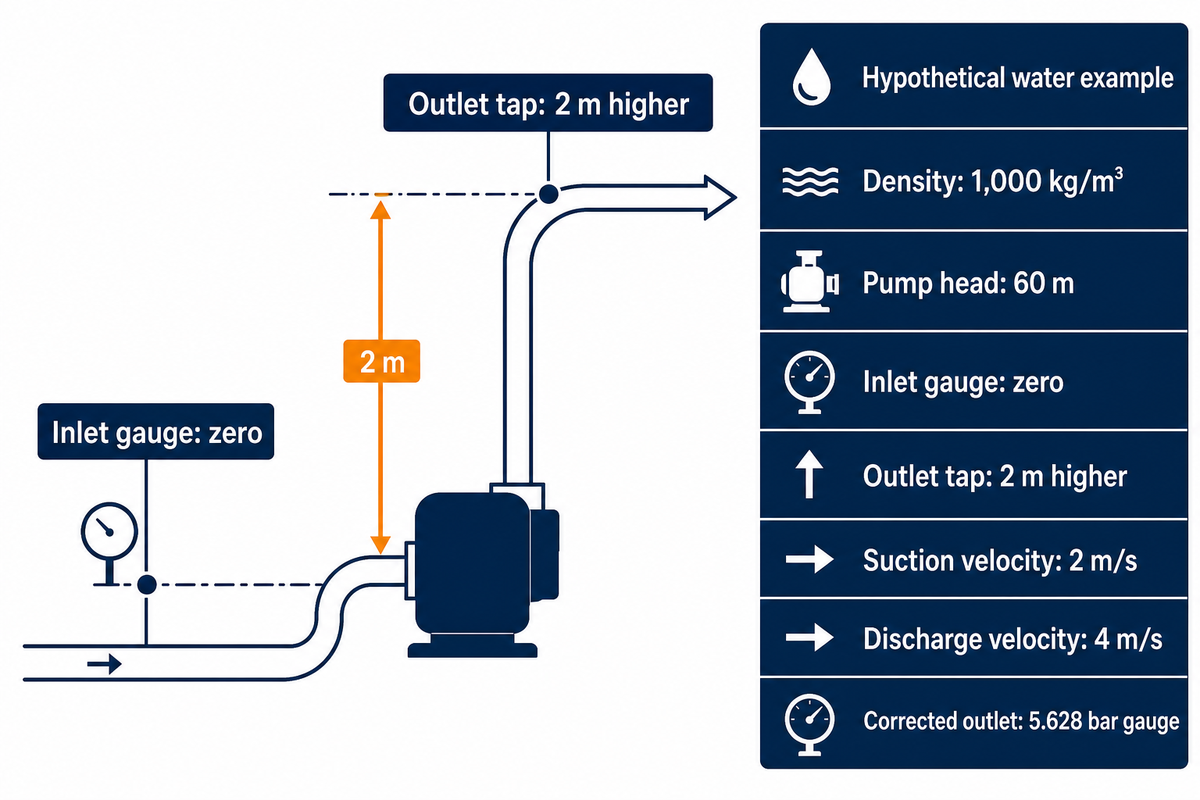
Liquid density affects the pressure associated with a given head. Measurement location changes how much of the energy appears as static pressure at a gauge. These are two different effects, and occur separately. Check both before concluding that a pump is underperforming.
A wall tap on a pump nozzle reads static pressure. Total pressure includes velocity contribution, so a smaller discharge nozzle can be significant, even when both instruments share the same pump centerline elevation. The vertical distance between taps determines the elevation pressure correction. Fluid density is valid for both the pressure conversion and the correction.
At 60 m, SG 1.2 gives a 7.061 bar pressure rise, compared with 5.884 bar at SG 1. A denser liquid also alters the demand for hydraulic power, so check the motor power requirement. Viscosity and density are different properties, and density alone doesn’t describe viscosity. For pumps for chemical service, obtain properties at the operating temperature instead of treating every liquid like water.
Peter Gaydon’s Hydraulic Institute explanation of viscous pumping gives corrections for water tested performance. A head-to-pressure conversion cannot perform those corrections. Ask the supplier for the applicable curve when viscosity differs materially from the test liquid.
For another hypothetical check, take water at 1,000 kg/m³, 60 m pump head and zero inlet gauge pressure. Let the outlet tap sit 2 m above the inlet tap, with velocities of 4 m/s at discharge and 2 m/s at suction. The velocity-head difference is (16 − 4)/(2 × 9.80665), or about 0.612 m. Pressure head is therefore 60 − 2 − 0.612 = 57.388 m, giving about 5.628 bar gauge. The simplified calculation would give 5.884 bar. This case assumes there would be no additional loss between the taps and the pump boundaries; remote gauges should account for additional losses.
Use the pump curve at the actual flow rate
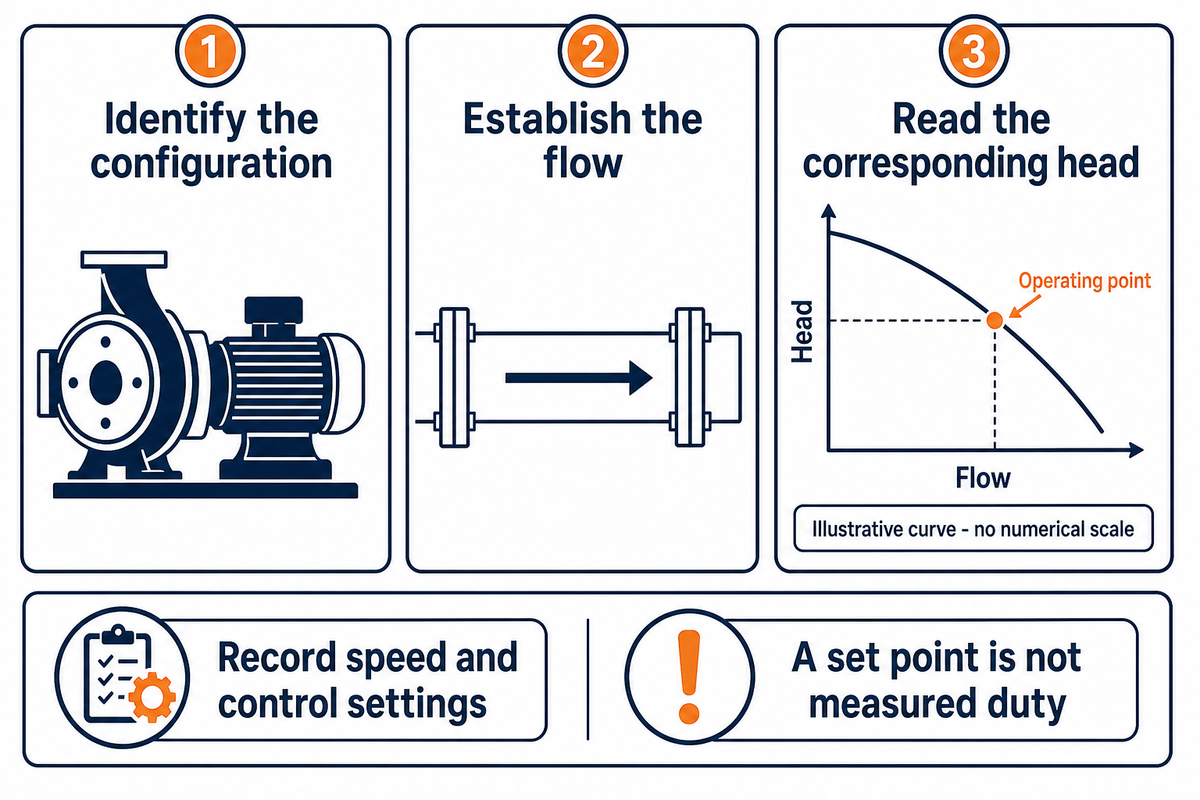
A head value is useful only in the operating condition being calculated. For an existing installation, take flow and speed measurements. For a proposed passive system, determine the operating point from the pump and system curves. The presence of a purchase target or control set point doesn’t necessarily mean that the installed pump achieves that duty.
- Identify the configuration. Match model, impeller diameter, speed and liquid to the supplied curve.
- Establish the flow. Use measured data, or solve the proposed system and pump relationship.
- Read the corresponding head. Use that value in the pressure calculation and check the operating range.
The Hydraulic Institute’s system-curve explanation illustrates how static demands and flow-related friction combine. Our pump and system curve intersection guide covers the rest of that sizing approach. An active control valve can vary its loss to maintain a set point, while a variable-speed drive changes the pump curve; record the control state with your inputs.
For curve interpretation, distinguish static head from head loss that varies with flow. A suitable friction loss formula belongs in the system calculation, not as an extra subtraction after losses are accounted for. If an increase in restriction reduces flow and moves the operating point, an undersized pump can’t be corrected by changing units.
Affinity laws can estimate the effects of speed changes within their assumptions, but select the equipment manufacturer’s applicable curves for final assessment. Have the pump operator record speed and control settings with readings; a coupling or drive arrangement that changes shaft speed makes the motor setting alone insufficient.
“The pump manufacturer should be consulted to define this region.”
Check the operating range and pressure limits
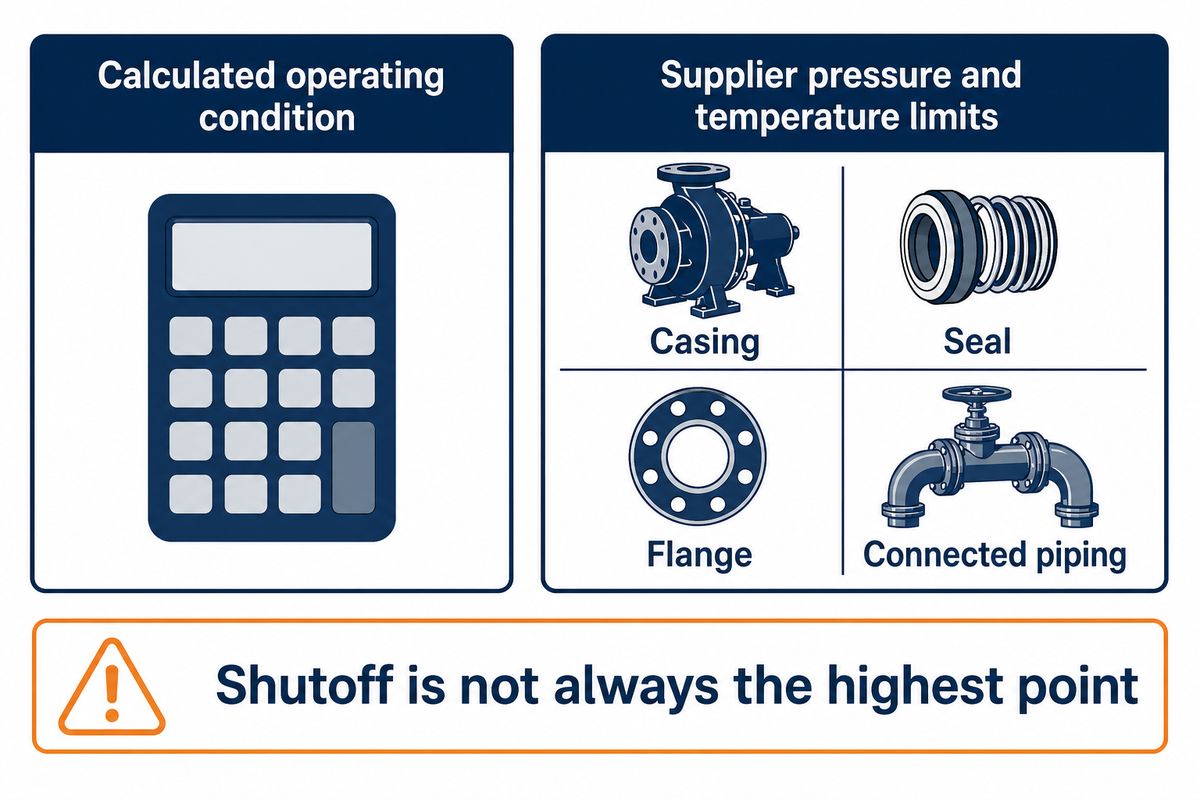
One operating case is the normal duty calculation. Review other credible inlet pressures, speeds and flow conditions with the supplier, then compare predicted pressures with the allowable limits for the specific assembly and temperature. Limits for casing, seal, flange and connected piping should be documented separately; a hydraulic curve shouldn’t be relied upon to approve them.
Don’t assume that the shutoff point is always the curve’s highest point. In Lev Nelik’s discussion of unstable pump curves, a running pump can generate a head above an identical pump’s shutoff head. That is a curve-specific counterexample, not a claim that every centrifugal pump behaves this way. Request the applicable full curve instead of extrapolating from one rated point.
Don’t close a discharge valve to obtain a calculation input. Also separate steady pressure prediction from transient assessment. This steady-state equation may not address some process requirements, such as rapid valve movement, changing upstream conditions, etc.
Key takeaway
Calculate outlet pressure from the actual hydraulic condition, then check the supplier’s pressure and temperature limits separately. Passing the arithmetic does not establish an acceptable operating range.
Send a usable calculation to the pump supplier
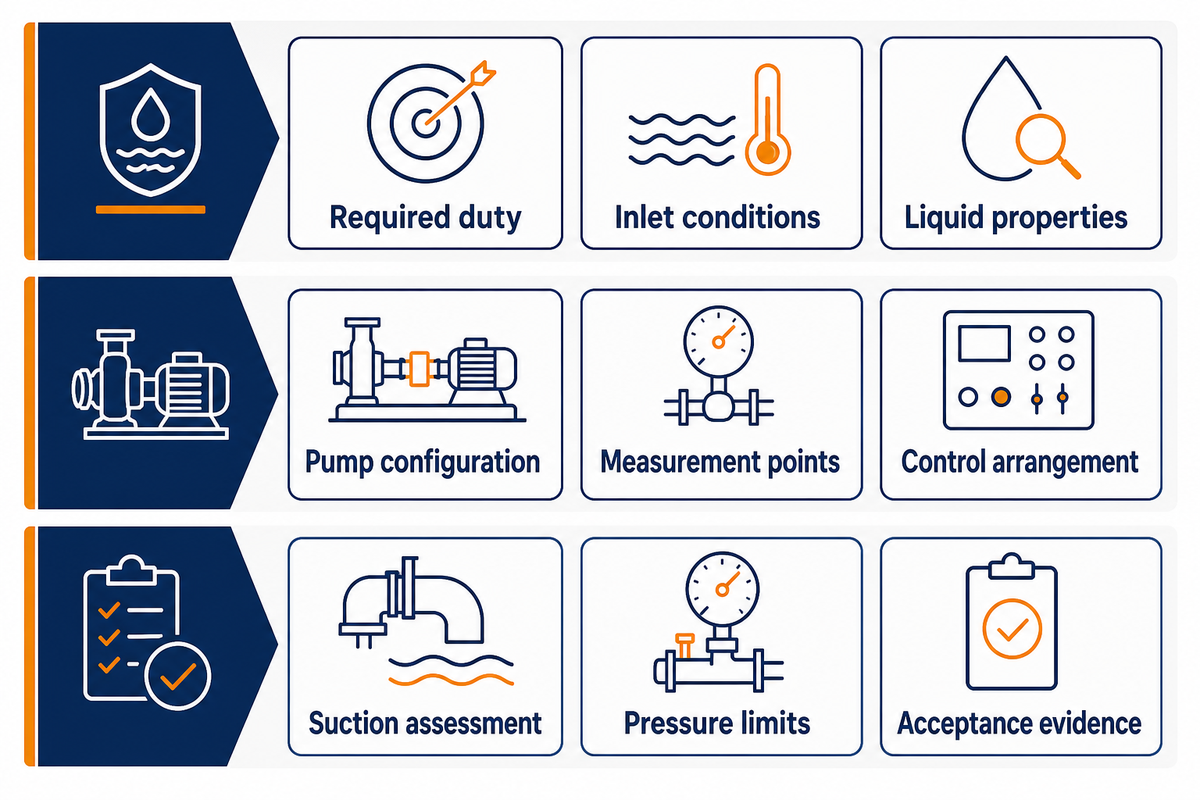
Give your supplier the inputs needed to replicate the pressure calculation and identify its limits. The ANSI/HI 14.6 public overview separates testing of hydraulic performance from hydrostatic pressure testing. See what test basis and acceptance conditions apply to your order. Do not evaluate a plotted head as a pressure rating.
| Input or record | What to supply | Decision it supports |
|---|---|---|
| Required duty | Flow range and outlet-pressure requirement, with units | Process duty versus available pump performance |
| Inlet conditions | Minimum, normal and maximum pressure; gauge or absolute | Required boost and operating cases |
| Liquid properties | Density, viscosity, temperature and composition | Curve applicability and materials review |
| Pump configuration | Model, speed range and impeller diameter | Correct curve selection |
| Measurement points | Tap positions, elevations and pipe inside diameters | Velocity and elevation corrections |
| Control arrangement | Valve mode, drive control and upstream equipment | Whether the assumed duty can occur |
| Suction assessment | Available suction head basis and supplier margin requirement | Feasibility of the assumed head |
| Pressure limits | Assembly ratings at temperature and transient review basis | Mechanical suitability |
| Acceptance evidence | Required test standard, edition, tolerances and report | Comparable offers and order acceptance |
The plant team can supply the operating conditions, the quality team can evaluate the acceptance evidence, and procurement can compare offers on the same basis. An unresolved inlet-pressure range can change the required pump, so resolve it before comparing prices. Review BBP’s centrifugal pump options or discuss multistage pump selection with this input sheet attached.
Frequently asked questions
Should I use absolute or gauge pressure in pump calculations?
Use one pressure reference throughout the calculation.
If suction pressure is in bar gauge and the pump adds a pressure difference in bar, the result is discharge pressure in bar gauge. If you start with absolute suction pressure, the result is absolute discharge pressure. Convert references before combining readings from different instruments. Checks involving vapor pressure and available net positive suction head require absolute pressure; a negative gauge reading alone doesn’t establish whether the suction condition is acceptable.
How do I verify pump curve data is correct?
Match the curve to the supplied configuration and test conditions.
Check the pump model, impeller diameter, rotational speed and test liquid before reading a head value. Locate the intended flow on that curve, and ask the manufacturer which performance tolerances and acceptance conditions apply. If you compare the prediction with field measurements, record both pressure taps, their elevations, pipe diameters and operating flow. A curve from another speed or impeller configuration can predict a different duty point for your installed system.
What is Specific Gravity (SG)?
Specific gravity compares a liquid’s density with a stated reference density.
Water is the usual reference for pump calculations, and the ratio has no units. A value of 1.2 means the liquid is twenty percent denser than that reference water under the stated conditions. Use density or specific gravity at operating temperature, and identify the reference basis. This property converts head to pressure; it doesn’t describe viscosity or guarantee that a water test curve remains suitable for another liquid.
How much does elevation change the pressure?
For a stationary column, pressure difference is density multiplied by gravity and vertical height.
One metre of reference water corresponds to approximately 0.098 bar. Flowing pipework also has velocity effects and friction losses, so elevation alone doesn’t predict every remote gauge reading.
Why does my pump data sheet show lower suction pressure at shutoff than at normal flow?
The pump curve alone cannot explain that difference.
Ask which upstream operating case, pressure reference and measurement location each value represents. An upstream pump, control system or different tank condition may change inlet pressure. Confirm the data sheet assumptions before using either value.
Prepare your pump duty for review
Send BBP the flow range, liquid properties, inlet-pressure range and required outlet pressure. Include the existing curve and measurement locations when checking an installed pump.
Calculation basis: The examples are simple steady state flow illustrations using published hydraulic relations. They aren’t BBP test results or product ratings. Project selection requires the applicable pump curve, liquid properties, suction assessment and supplier-approved operating limits.
References & Sources
- Pump Curves Hydraulic Institute.
- System Curves Hydraulic Institute.
- Guide to the SI, Appendix B.9 National Institute of Standards and Technology.
- How Viscosity Affects Pumping Peter Gaydon, Hydraulic Institute, 2022.
- Pump FAQs Hydraulic Institute.
- Choosing the Right Pump Hydraulic Institute.
- Stable and Unstable Pump Curves Lev Nelik, Pumps & Systems, 2011; cited for curve behavior.
- ANSI/HI 14.6: Hydraulic Performance Acceptance Tests Hydraulic Institute, public overview.